Mixed Methods Social Science Poster Template (Free)
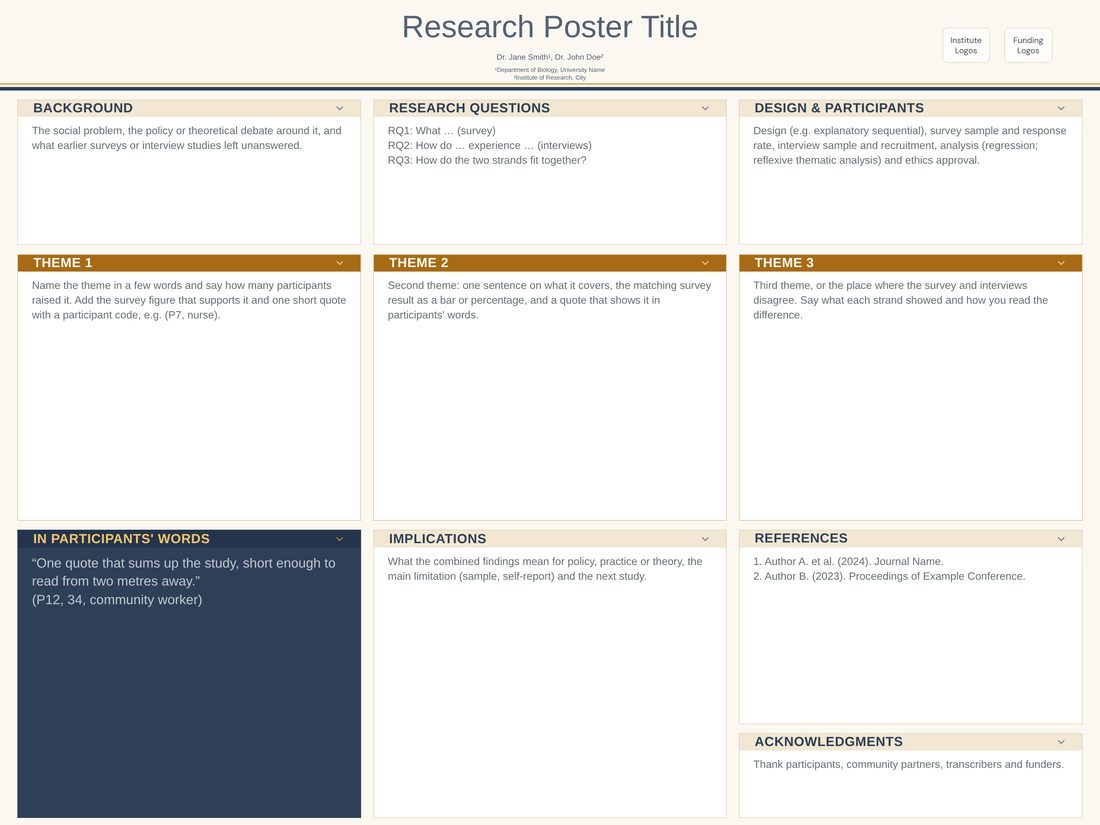
Free template. Field: Social Science. Layout: 3 rows, themes row.
Mixed Methods opens with a light header and a slate-and-ochre underline on warm paper. A set-up row holds the background, research questions and design. The middle row is a themes row with ochre bands: each theme box carries the survey result that supports it and a short quote. Below it a dark slate In Participants' Words box gives one quotation room to be read from across the aisle, beside the implications and references.
Best for: Sociology, education, social work, public policy and health services research using surveys, interviews, focus groups or explanatory sequential mixed-methods designs.
Size: 48 × 36 in landscape (122 × 91 cm, the most common US landscape size).
Download PPT (48 × 36 in). Free PowerPoint download, no sign-in. Or fill it in with the free online editor; your first export from the editor (PPTX or SVG) needs no account, and a free account keeps exports free after that.
Layout and sections
3 rows, themes row. Preview rendered in the editor at 48 × 36 in landscape; the layout reflows to every size.
- Background
- Research Questions
- Design & Participants
- Theme 1
- Theme 2
- Theme 3
- In Participants' Words
- Implications
- References
- Acknowledgments
Tips for this template
- Name each theme in four or five words and put the participant count beside it, such as 14 of 20 interviewees.
- Choose the shortest quote that makes your main point for the dark box, and give it a participant code rather than a name.
Download Mixed Methods PowerPoint by size
- Landscape
- 48 × 36 in .pptx | 56 × 42 in .pptx | 36 × 24 in .pptx | 48 × 24 in .pptx | 56 × 36 in .pptx
- Portrait
- 36 × 48 in .pptx | 42 × 56 in .pptx | 24 × 36 in .pptx | 36 × 56 in .pptx
- ISO portrait
- A0 portrait .pptx | A1 portrait .pptx | A2 portrait .pptx
- ISO landscape
- A0 landscape .pptx | A1 landscape .pptx | A2 landscape .pptx
- Square
- 42 × 42 in .pptx | 48 × 48 in .pptx
Similar templates
Related guides
- Making a results table: Paste numbers from Excel or Google Sheets and style a table that reads from two metres.
- Data visualisation on posters: Charts that read from across a room: line weights, labels and one highlighted comparison.