How to Make a Results Table for a Research Poster
Paste your numbers from Excel or Google Sheets, style the table so it reads from two metres and export it as a real PowerPoint table. Plus: when a chart works better.
By PosterScientist · Published · 6 min read

Quick answer
How do I make a good table for a research poster?
Keep a poster table small, about 3 to 6 rows and 3 to 5 columns, with a bold header row, units in the headers or caption, numbers rounded to meaningful digits and aligned, and the key result marked. In PosterScientist, paste cells from Excel or Google Sheets straight into the table; it exports to PowerPoint as a real, editable table.
Tables are the most underrated element of a research poster. A good one gives exact numbers at a glance; a bad one is a wall of digits copied from a paper. This guide covers when to use a table, how to build one in PosterScientist from your spreadsheet, and how to make it readable from two metres away.
Table or chart?
Before you paste anything, decide whether a table is the right tool.
- Choose a chart when the point is a trend over time, a difference between groups, or a relationship between two variables. People see a gap between two bars faster than they compare two numbers.
- Choose a table when the exact values matter, when there are only a handful of numbers, or when columns mix units, for example peak values, totals and p-values side by side.
- Use both for a key result: a chart for the pattern and a three-row table for the numbers people will want to quote.
The guide to data visualization on posters covers chart design in depth.
Build the table
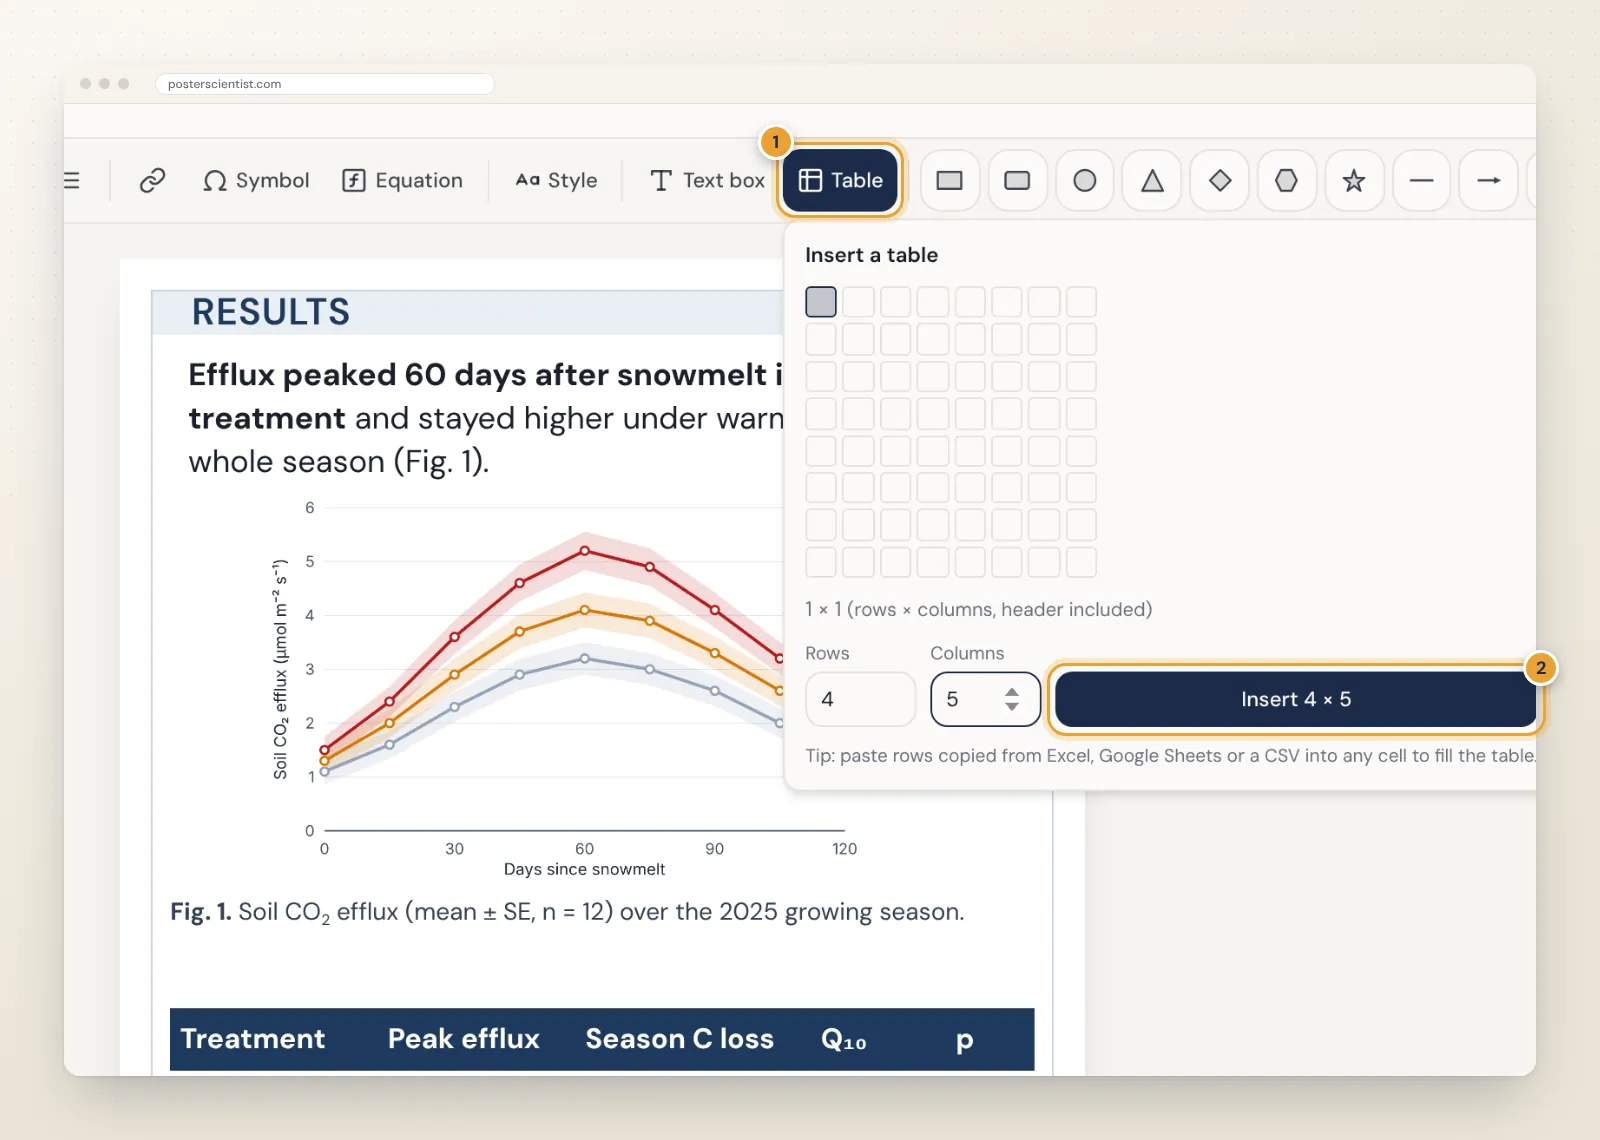
Open the box in focus view (double-click it, or select it and choose Focus on this box) and click Table in the toolbar. Hover over the grid and click to pick a size, or type the number of rows and columns and click Insert. The side panel also has a quick Add a 4 × 3 table to this box button. Tables can have up to 40 rows and 12 columns, though a poster table should use far fewer.
Paste your numbers from Excel or Google Sheets
You rarely need to type a results table by hand:
- Copy the cells in Excel, Google Sheets, Numbers or LibreOffice.
- Double-click the table (or select it and press Enter) and click the cell where the data should start.
- Paste. The table fills from that cell and adds rows and columns if the data is larger.
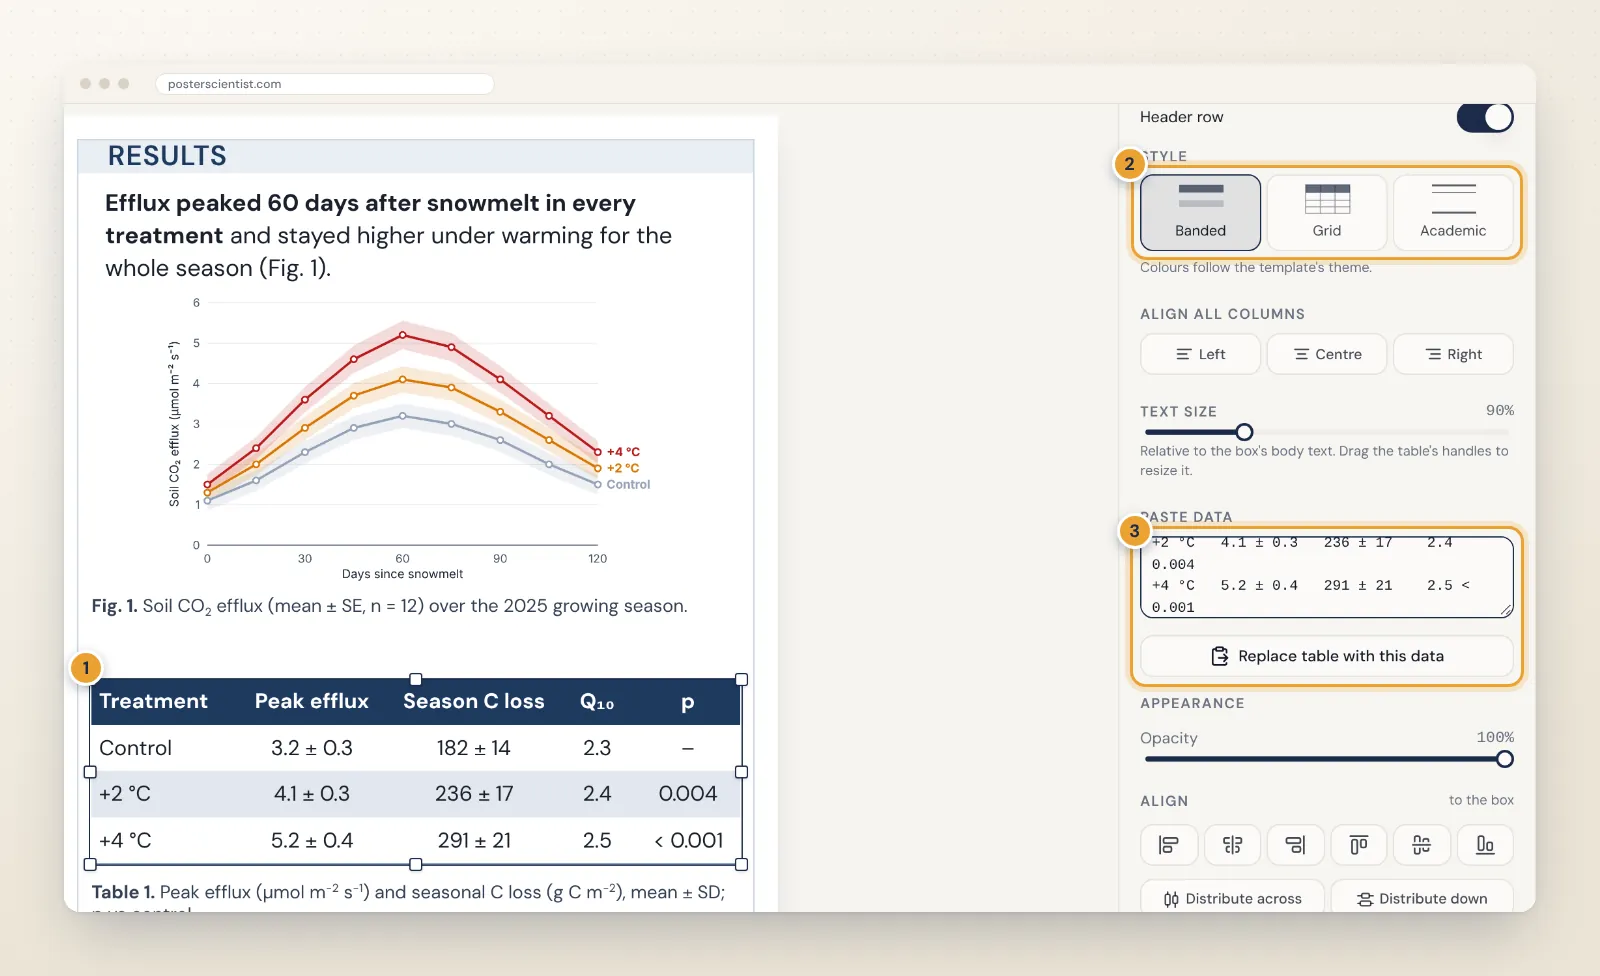
If you prefer, paste into the Paste data box in the table options and click Replace table with this data. Tab-separated data from a spreadsheet works, and so do comma-separated values from a CSV file.
Make it readable from two metres
- Keep the header row on. It is bold and, in the Banded and Grid styles, filled with the template's colour.
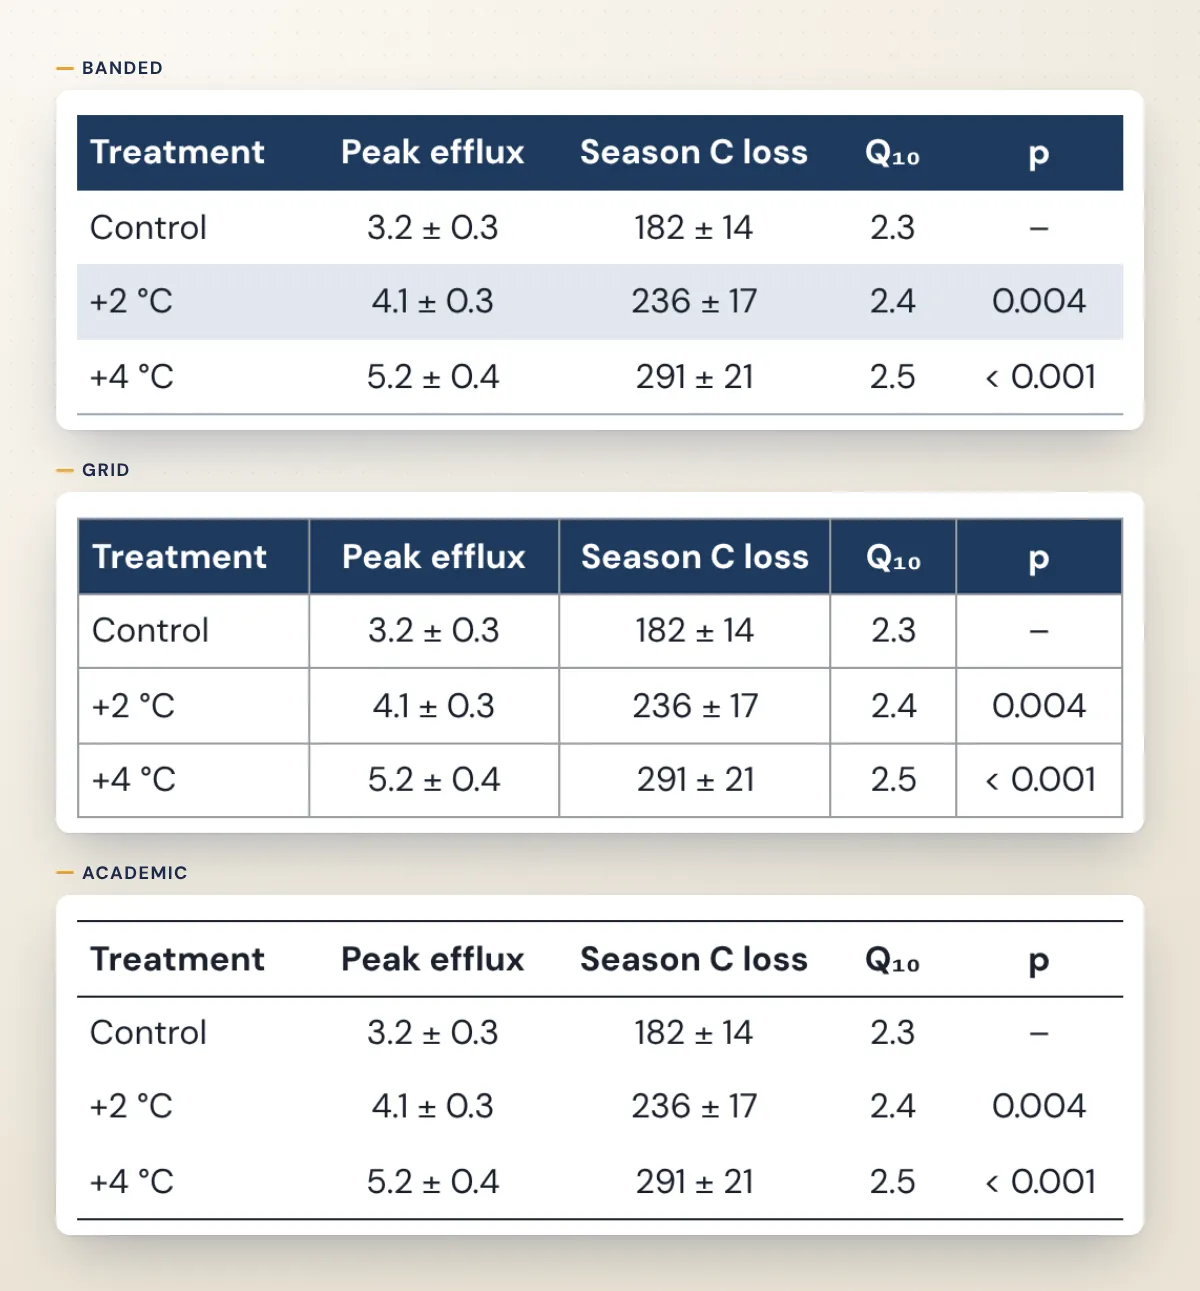
- Pick a style. Banded shades alternate rows, Grid draws lines around every cell, and Academic uses horizontal rules only, like a journal table. Colours follow the template's theme, so the table matches the poster.
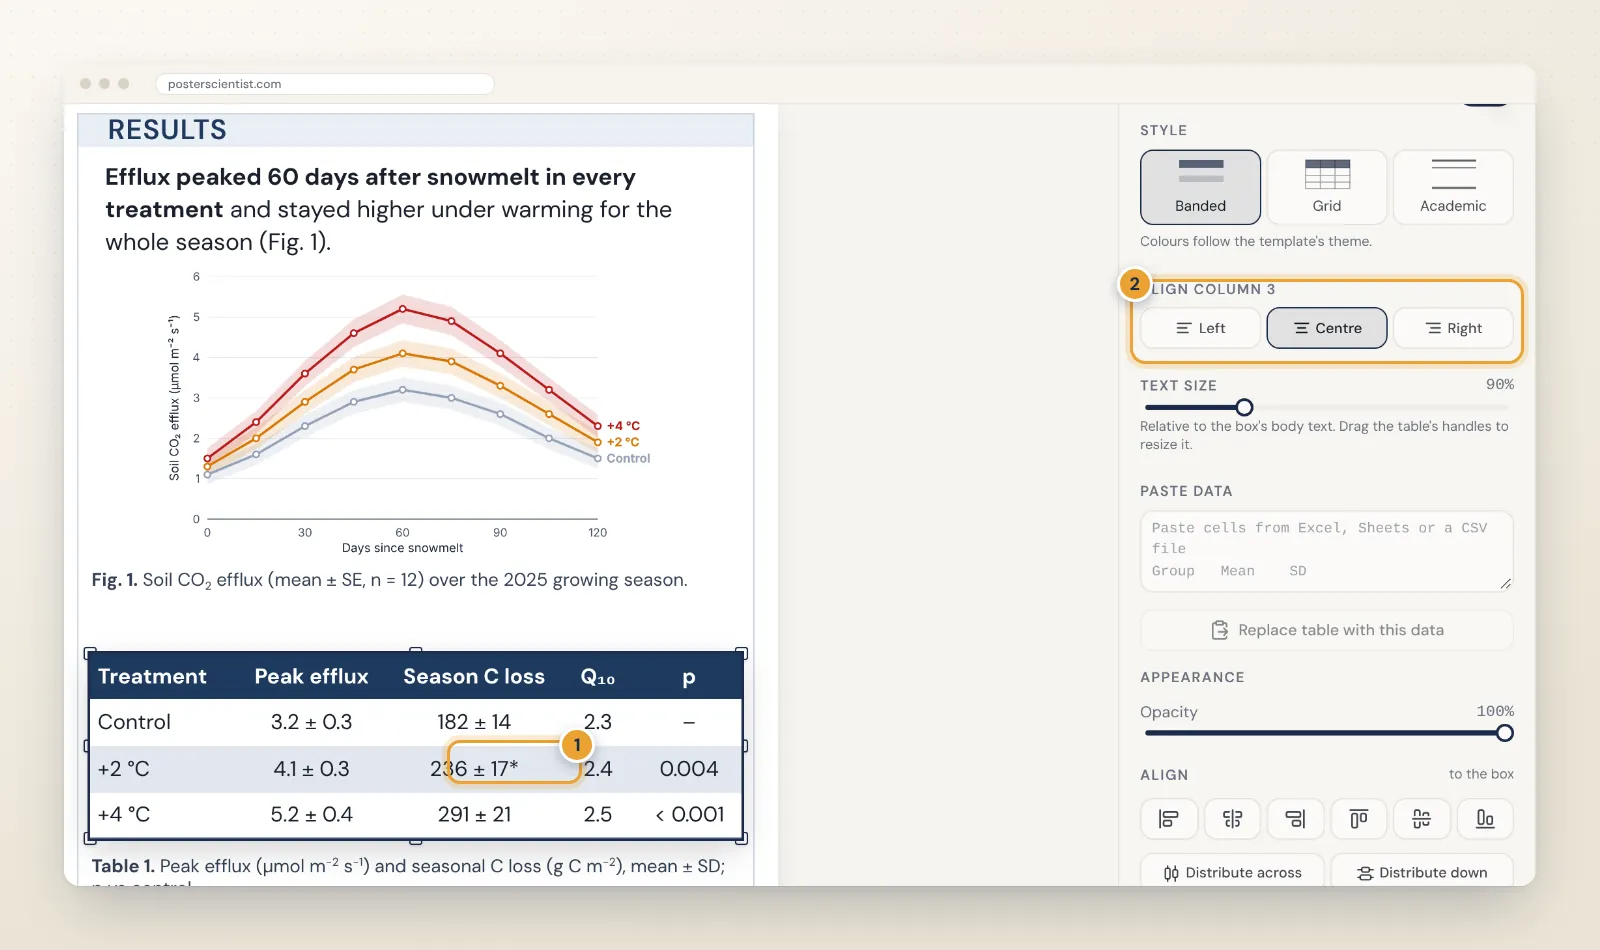
- Align columns. Left-align text and centre or right-align numbers so decimal places line up. Alignment works for all columns or for the selected column.
- Size the text. The Text size slider sets the table text relative to the box's body text, from 50 to 200 percent. Do not go much below the body size.
- Round sensibly. Two or three significant digits are usually enough on a poster. Put units in the column header or the caption, not in every cell.
Edit cells, rows and columns
Double-click the table or press Enter to type in its cells. Tab moves to the next cell, Enter moves down, Shift+Enter starts a new line inside a cell and Esc finishes. The options panel adds and removes rows and columns, inserts them above, below, left or right of the selected cell, and aligns the selected column.
Cells hold plain text, so type or paste characters such as ±, µ and ² directly; they come across from Excel unchanged. The guide to scientific symbols on posters lists the ones you need most.
Add a caption
Put a short caption under the table with a text box: "Table 1." in bold, what the values are (mean ± SD or mean ± SE), the sample size, the test behind any p-values and what symbols such as * mean. The caption is where units go if the headers are short. To draw attention to the key row, add a thin rounded outline with the Draw tools rather than colouring numbers.
A worked example
The screenshots above use a small warming experiment. The full analysis had 36 plots, 9 sampling dates and a dozen variables; the poster table keeps four rows and five columns: treatment, peak value, seasonal total, the derived temperature sensitivity and the p-value against the control. Units moved into the caption, values were rounded to two or three significant digits, and the season-long time series went into a chart beside the table instead. That split, chart for the pattern and table for the numbers people will quote, works for most results sections.
Common table mistakes
- Pasting the whole supplementary table. If a visitor needs more than ten seconds to find the key number, the table is too big.
- Too many decimal places. 3.2146 ± 0.3087 looks precise and reads slowly; 3.2 ± 0.3 says the same.
- Units repeated in every cell. Put them once, in the header or the caption.
- Grid lines everywhere at a small size. At poster distance, dense lines become grey noise. Try the Banded or Academic style.
- Body text smaller than the rest of the poster. Tables are often the first thing people photograph; keep them as readable as the text around them.
How tables export
Tables export to PowerPoint as real, editable tables, using the poster's fonts, fills and rules, so a co-author can still fix a value in PowerPoint. In the SVG export and the Pro PDF export they are drawn as vector shapes and text, so they stay sharp at any print size. If your results include formulas as well as numbers, the guide to equations on posters explains how to add them.
Start with a layout that has room for results
Templates with a wide results column, such as the free Psychology Study and Social Science designs, the clinical audit poster template and the public health poster templates, leave space for a table next to a chart. The poster layout guide explains how to give results the most space, and the free research poster maker has everything above built in.
Frequently asked questions
Should I use a table or a chart on my poster?
Use a chart when the message is a trend, a difference between groups or a relationship, because people see patterns faster than they read numbers. Use a table when exact values matter, when there are only a few numbers, or when columns have different units, such as a baseline characteristics table.
How many rows and columns should a poster table have?
As few as possible: about 3 to 6 rows and no more than 5 columns usually stays readable from two metres. Move the full table to a handout, the paper or a page linked by a QR code.
Can I paste a table from Excel or Google Sheets?
Yes. Copy the cells, click a cell in the table and paste: the table fills from that cell and adds rows and columns as needed. You can also paste into the Paste data box in the table options and replace the whole table. Tab-separated and comma-separated data both work, up to 40 rows and 12 columns.
Will my poster table be editable in PowerPoint?
Yes. Tables export to PowerPoint as native, editable tables with the poster's fonts, fills and rules, so you can still fix a number in PowerPoint. In SVG and PDF exports they are drawn as vector shapes and text.
How do I show statistical significance in a poster table?
Add a p-value column or mark significant values with symbols such as * or †, and explain them in a short caption under the table, together with the test used, the sample size and whether values are mean ± SD or mean ± SE.