Public health poster templates for epidemiology, evaluation and policy
Quick answer
What should a public health poster include?
A public health poster states the problem and population, the design and data source, the main measures (rates, prevalence or risk estimates with confidence intervals), results broken down by groups that matter for equity, and clear implications or recommendations. Programme evaluations add a logic model, and community projects credit their partners. Write the conclusion so that a policymaker could act on it.
Public health posters speak to a mixed audience: epidemiologists who want the methods, practitioners who want to know what worked and policymakers who want the one action to take. A good poster serves all three by putting the implication in plain language and the numbers where specialists can check them.
The free Public Health template is a square 42 × 42 in design with a full-width abstract and six equal panels; Modern Infographic suits outreach posters built around a few big numbers. Both download as editable PowerPoint files.
Open the Public Health template · See a public health example
Free PowerPoint downloads
- Public Health, 42 × 42 in square (.pptx)
- Public Health, 48 × 48 in square (.pptx)
- Public Health, 48 × 36 in landscape (.pptx)
- Public Health, A0 portrait (.pptx)
Editable .pptx with the slide set to the real poster size. One click, no sign-in.
Templates for public health posters
-
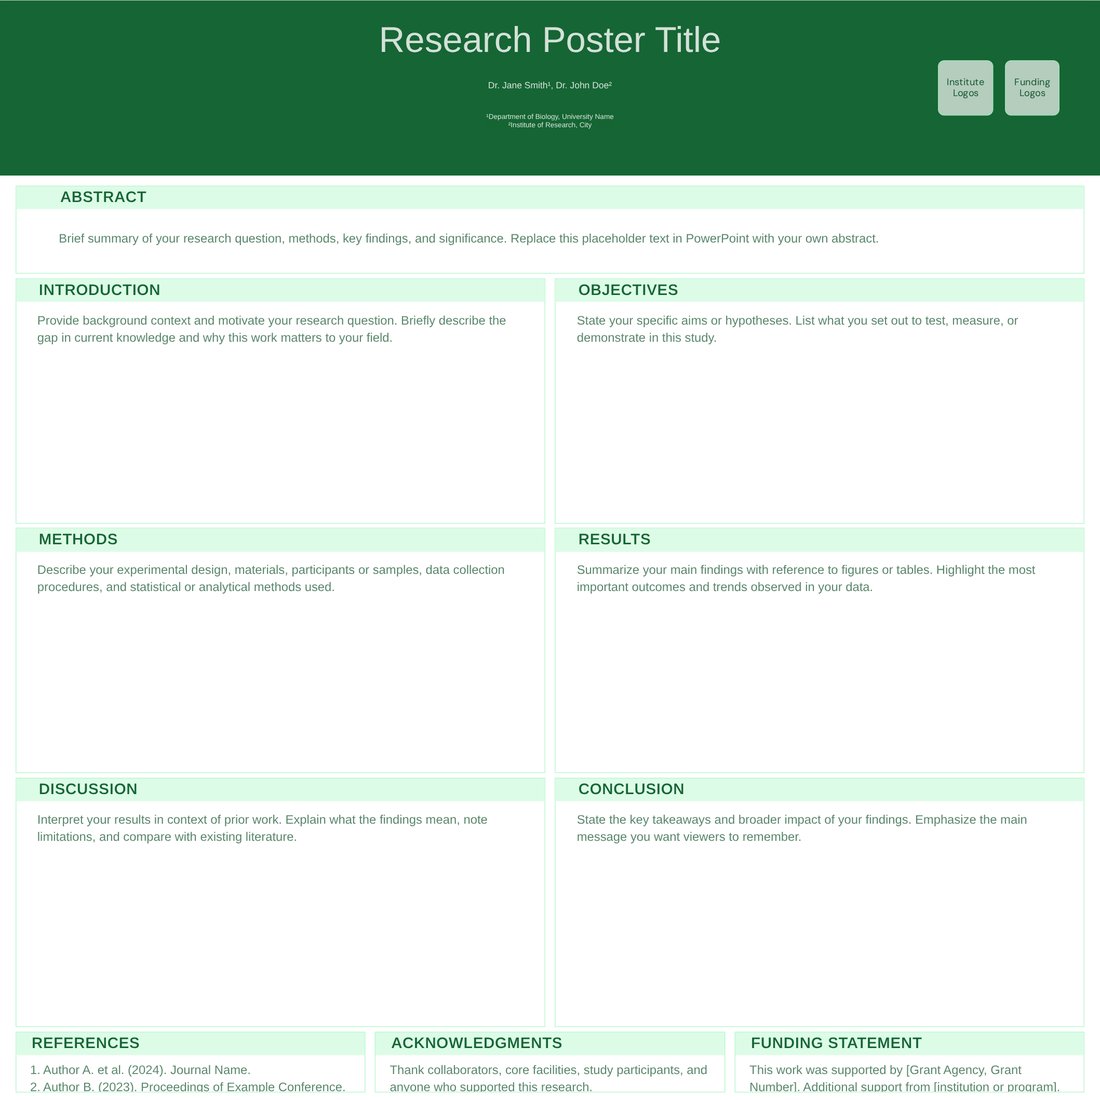
Public Health (Free)
Free. Square 42 × 42 in with a full-width abstract, six equal panels and a back-matter strip for references, acknowledgements and funding. Reflows to landscape or portrait sizes.
-

Modern Infographic (Free)
Free. A wide central column for one headline rate or map, with orange accents for key numbers; suits community-facing and outreach posters.
-
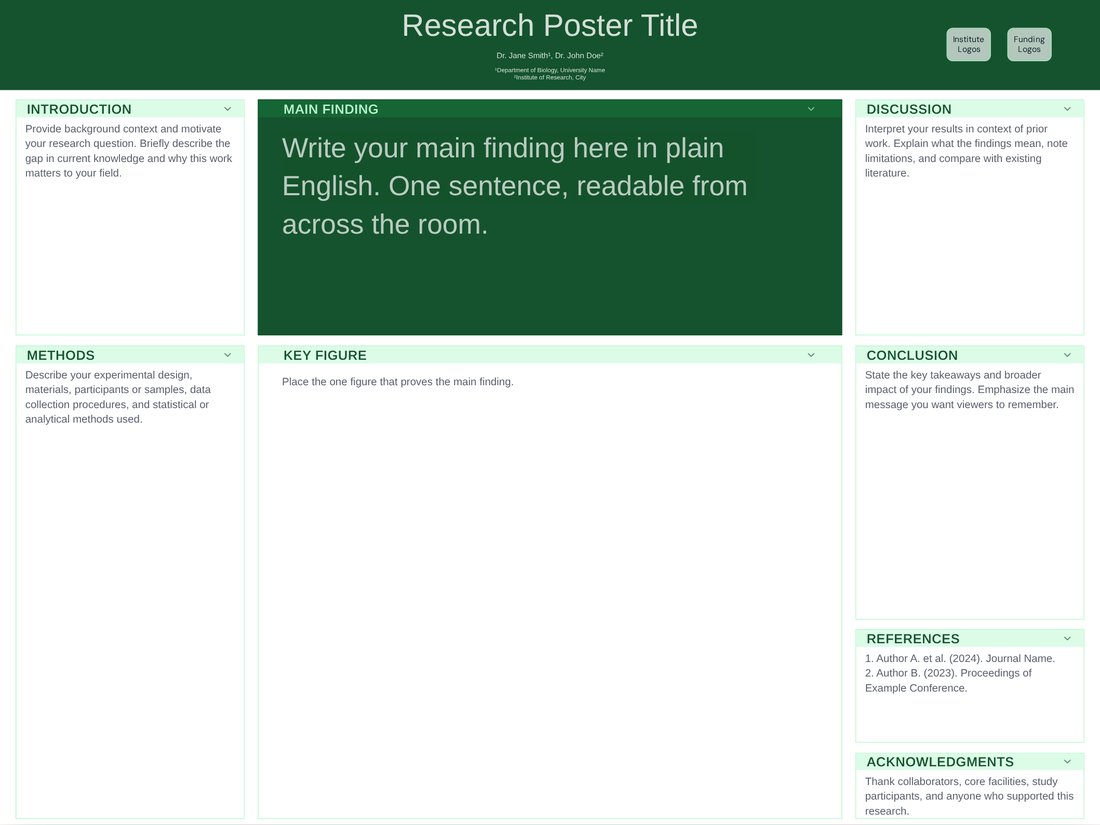
Billboard (Free)
Free. Better-poster layout with one plain-language main finding in very large type; good when the message is a single policy-relevant result.
Structure for an epidemiology poster
STROBE is the reporting guideline for observational studies, and its RECORD extension covers studies using routinely collected data such as registries and electronic health records.
- Background: the burden of the problem in your population and the gap your study fills.
- Methods: design (cross-sectional, cohort, case-control or ecological), setting, period, data source and case definitions.
- Analysis: outcome and exposure definitions and the statistical approach, for example Poisson regression for rates or logistic regression for odds ratios.
- Results: the main estimate with its 95% confidence interval, then stratified results.
- Public health implications: what should change, for whom, and who can make it happen.
Rates, maps and uncertainty
- Give the denominator and units ("per 100,000 population per year") and say whether rates are crude or age-standardised, and to which standard population.
- Show a confidence interval for every estimate; a dot-and-interval plot compares groups or areas better than a table.
- Choropleth maps need a legend with class breaks, a colour-blind-safe sequential palette, a scale bar and a data source line.
- Suppress or combine small counts so individuals cannot be identified; many agencies set a small-number threshold, so follow yours.
Programme evaluations and logic models
For a programme or intervention evaluation, a logic model diagram (inputs, activities, outputs, short-term and long-term outcomes) explains the theory of change in one panel. Follow it with process measures such as reach, fidelity and dose delivered, then outcome measures, and name the evaluation framework you used, for example RE-AIM (reach, effectiveness, adoption, implementation, maintenance).
Equity and community partners
- Break results down by groups relevant to equity, such as deprivation, ethnicity, rurality or age, and comment on the gaps.
- Use person-first, non-stigmatising language, for example "people who use drugs".
- List community partners as co-authors where they contributed, or credit them in the acknowledgements.
- Add a plain-language summary for community audiences, or a QR code that links to one.
What public health conferences usually ask for
Public health meetings often sort abstracts into sections or tracks, such as epidemiology, health policy, environmental health and health equity, and may offer printed posters, e-posters or both. Expect a structured abstract (background, methods, results, conclusions) and sometimes a statement of public health implications or learning objectives. Board sizes vary and some venues use square boards; the Public Health template opens at 42 × 42 in but reflows to any listed size.
Frequently asked questions
What is the best template for a public health poster?
Public Health for epidemiology and evaluation posters (square 42 × 42 in, six panels), Modern Infographic for outreach posters built around a few numbers, and Billboard for a single policy message. All three are free.
Should I use crude or age-standardised rates?
Use age-standardised rates when you compare populations with different age structures, and name the standard population. Crude rates are fine for describing the burden in a single population.
How do I show a map on a public health poster?
Make it large, use a sequential colour-blind-safe palette with a clear legend, add a scale bar and data source, and suppress small counts that could identify people.
Can I change the square template to landscape?
Yes. Open it in the editor and choose 48 × 36 in, A0 or any other size; the panels reflow. Free PowerPoint downloads are available at every listed size.
What goes in the public health implications section?
One to three concrete actions, who should take them (clinicians, services, policymakers or communities) and what evidence would strengthen the case, written in plain language.