Medical research poster examples: trials, cohorts, reviews and case reports
Quick answer
How do you make a medical research poster?
Start from the reporting guideline for your study design: CONSORT for a trial, STROBE for a cohort or case-control study, PRISMA 2020 for a systematic review, CARE for a case report and SQUIRE for an audit or quality improvement project. Make the title state the finding, show the participant or study flow as a diagram, give the main result as an effect size with its 95% confidence interval in one clear figure, state the main limitation, and end with Vancouver references and a QR code.
Medical posters are judged quickly by people who know the reporting guidelines, so the fastest way to look credible is to follow the structure they expect for your study design. The examples below cover the designs that most often reach medical and health conferences.
Each one is a finished poster built in the PosterScientist editor: download it as an editable PowerPoint file, or open it in the editor and swap in your own study.
Note: The authors, institutions, patients and data on these posters are illustrative, made up to show what a finished poster looks like; they are not real cases or studies. Images marked "Simulated image" are generated, not real scans. The references are real: each one was checked and links to the published paper or guideline.
Medical poster templates · Case report poster examples
Match the poster to the study design
Reporting guideline and key figure for each kind of medical poster, with the example that shows it
| Study design | Reporting guideline | Key figure | Example on this page |
|---|
| Randomised trial | CONSORT 2025 | Participant flow diagram; primary outcome by arm with effect and 95% CI | Mobilisation after hip fracture surgery |
|---|
| Cohort or case-control study | STROBE | Cohort flow; Kaplan–Meier curve with numbers at risk; adjusted hazard ratio | SGLT2 vs DPP-4 inhibitors and heart failure |
|---|
| Systematic review and meta-analysis | PRISMA 2020 | PRISMA flow diagram; forest plot with pooled estimate and I²; risk of bias | Tranexamic acid in knee replacement |
|---|
| Case report | CARE | Timeline; investigations table; the image that made the diagnosis | Three case reports |
|---|
| Audit or quality improvement | SQUIRE 2.0 | Compliance against the standard, cycle by cycle; the change made | Antibiotic review dates audit |
|---|
| Laboratory or in vitro study | Field conventions (methods, replicates, statistics) | Dose–response curves with IC₅₀ and 95% CI | N-acetylcysteine and acetaminophen toxicity |
|---|
Medical research poster examples
-
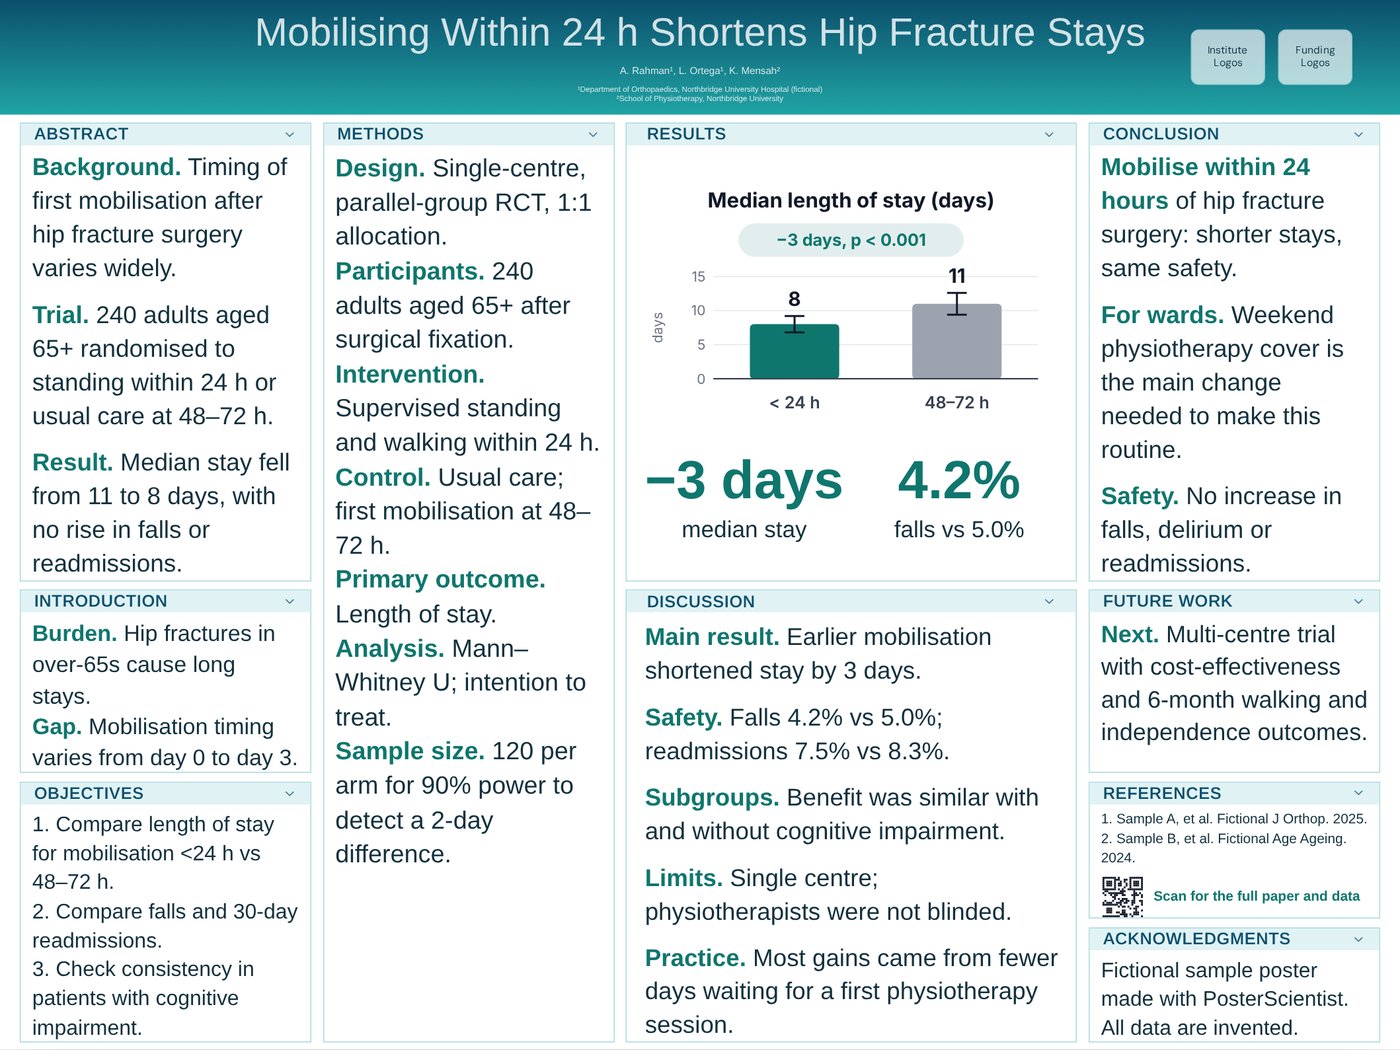
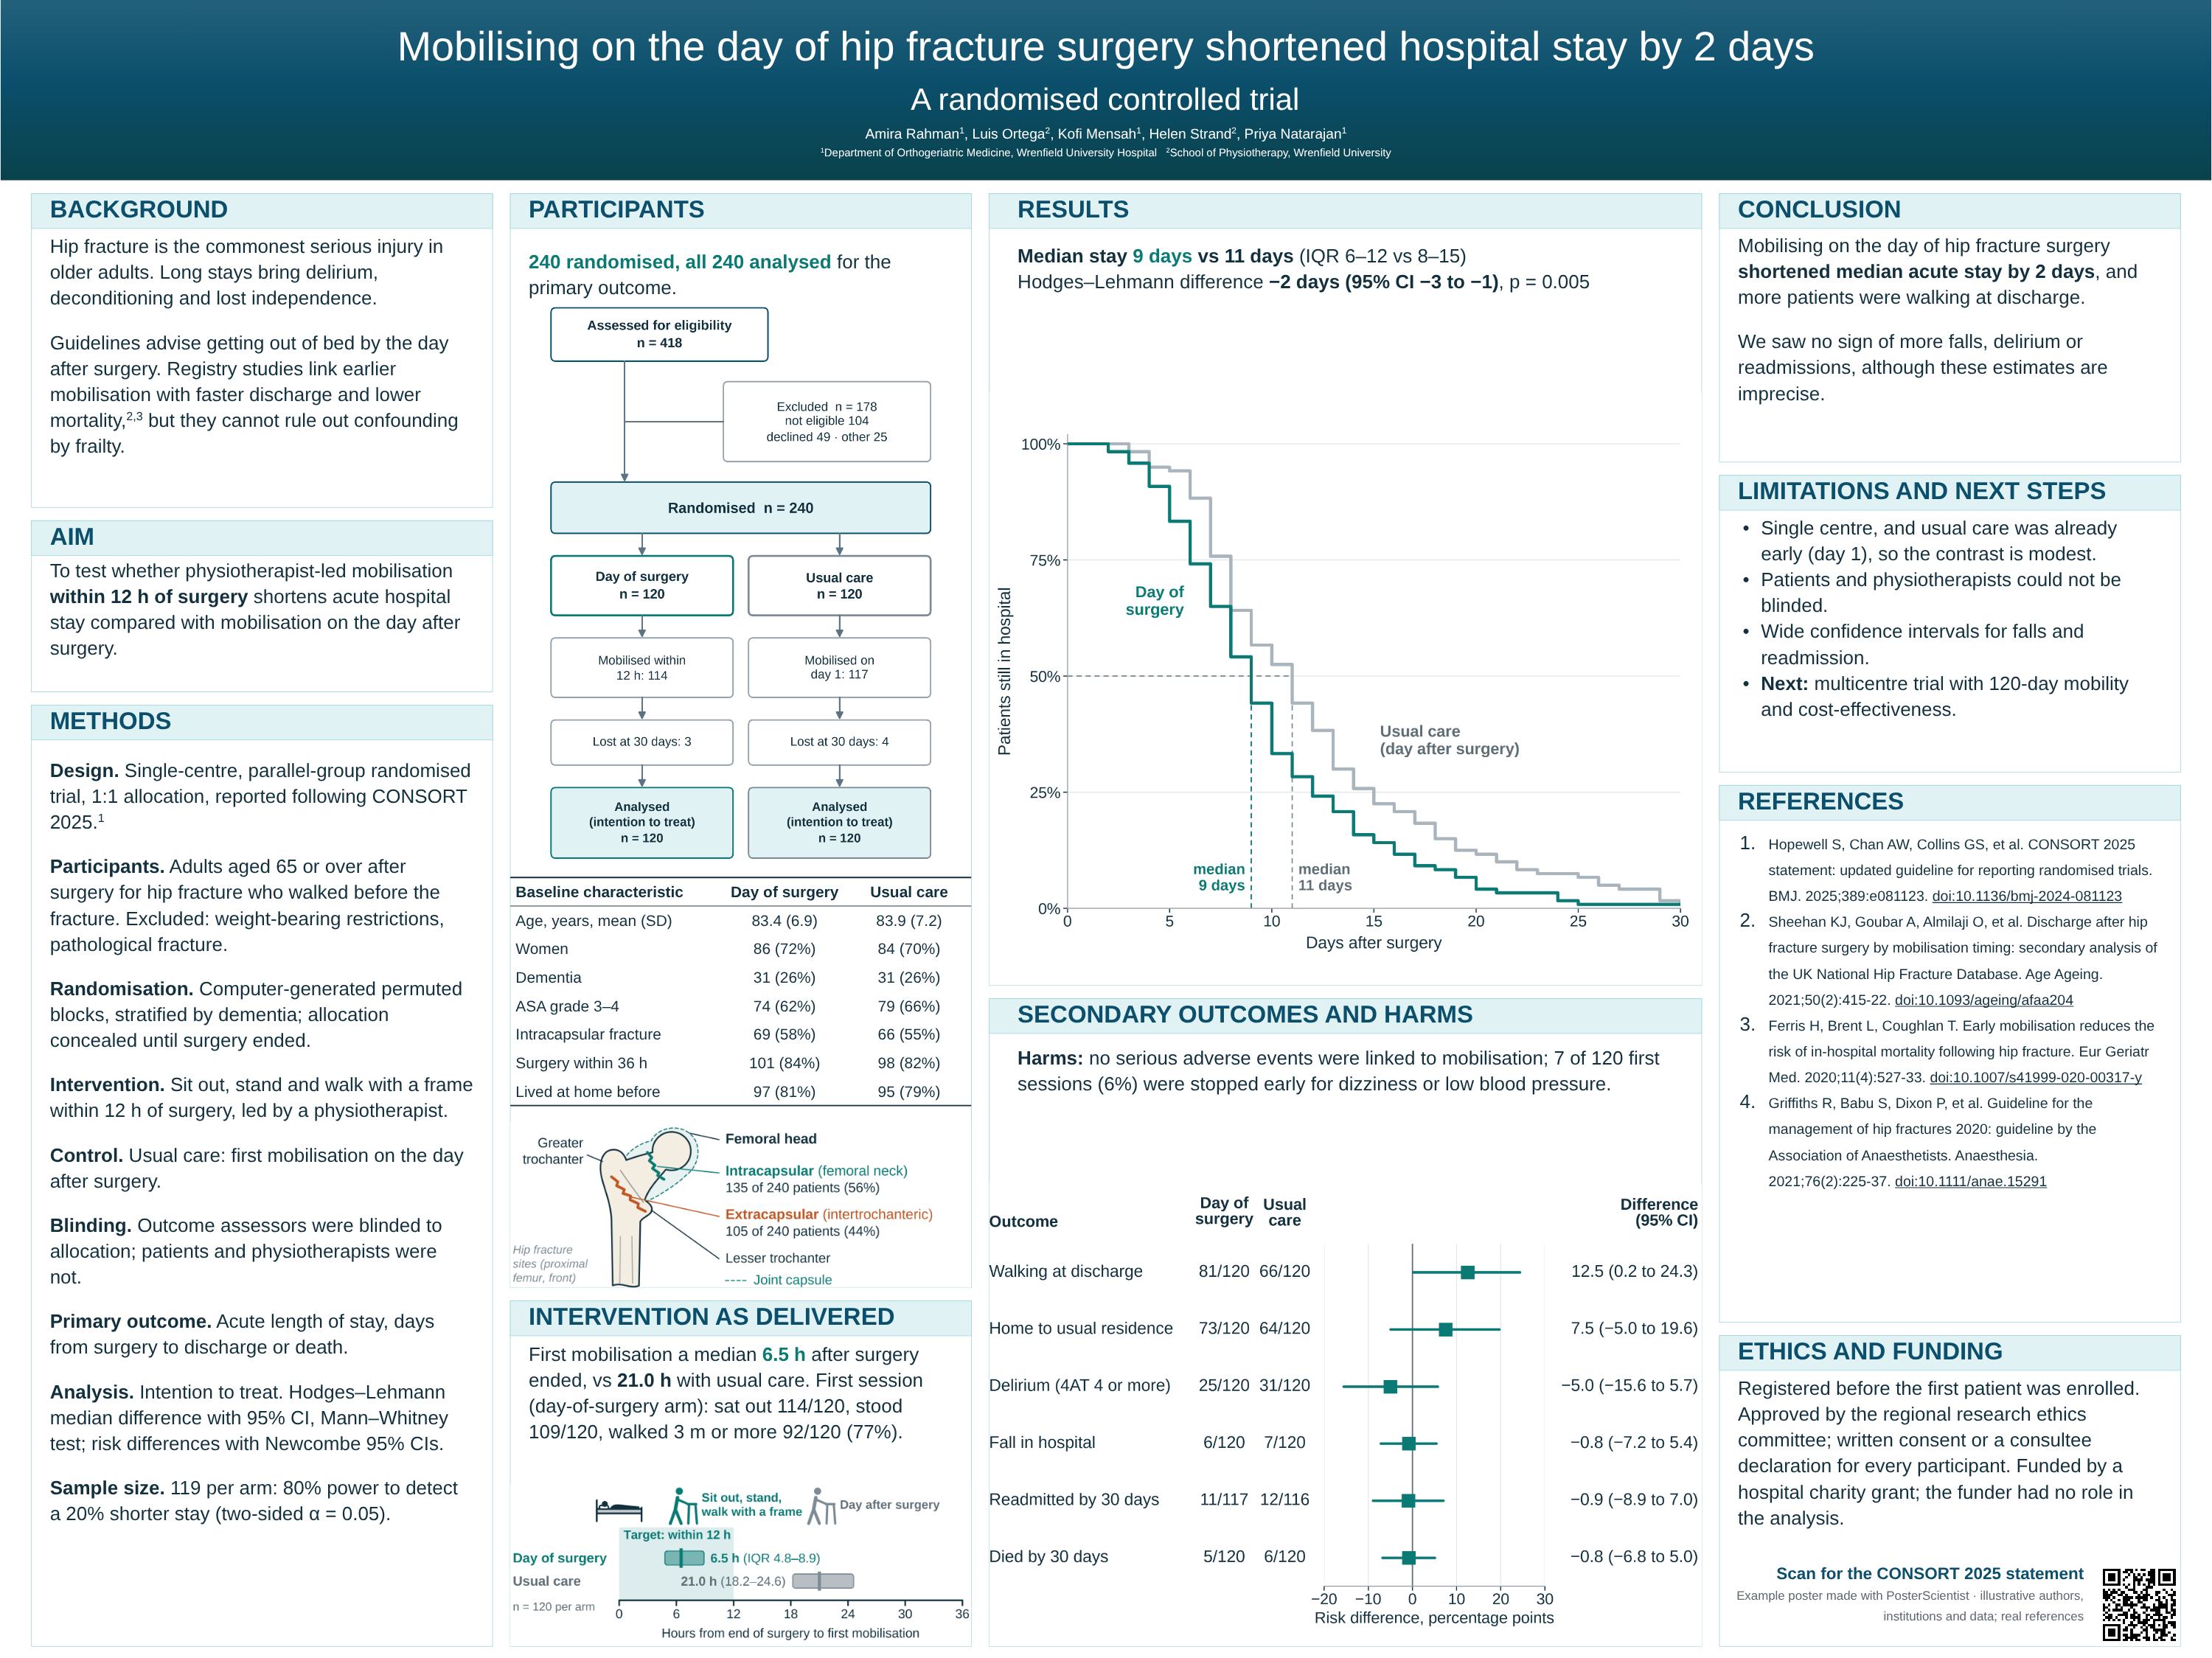
Mobilising on the day of hip fracture surgery shortened hospital stay by 2 days
Medicine · randomised controlled trial · Template: Clinical Trial (Free) · 48 × 36 in landscape · Follows: CONSORT 2025: flow diagram, prespecified primary outcome, effect size with 95% CI
Why it works
The title gives the result, not the topic. Methods read like a CONSORT checklist (design, participants, randomisation, intervention, outcome, sample size), the flow diagram accounts for every patient, and the main chart shows time to discharge for both arms with the effect and its 95% CI beside it. Harms and a limitation get their own lines. A femur sketch shows where the hips broke (as in the baseline table), and a timeline graphic shows how soon each arm got up after surgery.
References on the poster (Vancouver style)
- Hopewell S, Chan AW, Collins GS, et al. CONSORT 2025 statement: updated guideline for reporting randomised trials. BMJ. 2025;389:e081123. doi:10.1136/bmj-2024-081123
- Sheehan KJ, Goubar A, Almilaji O, et al. Discharge after hip fracture surgery by mobilisation timing: secondary analysis of the UK National Hip Fracture Database. Age Ageing. 2021;50(2):415-22. doi:10.1093/ageing/afaa204
- Ferris H, Brent L, Coughlan T. Early mobilisation reduces the risk of in-hospital mortality following hip fracture. Eur Geriatr Med. 2020;11(4):527-33. doi:10.1007/s41999-020-00317-y
- Griffiths R, Babu S, Dixon P, et al. Guideline for the management of hip fractures 2020: guideline by the Association of Anaesthetists. Anaesthesia. 2021;76(2):225-37. doi:10.1111/anae.15291
Download PowerPoint · Open in editor · Use this template
-
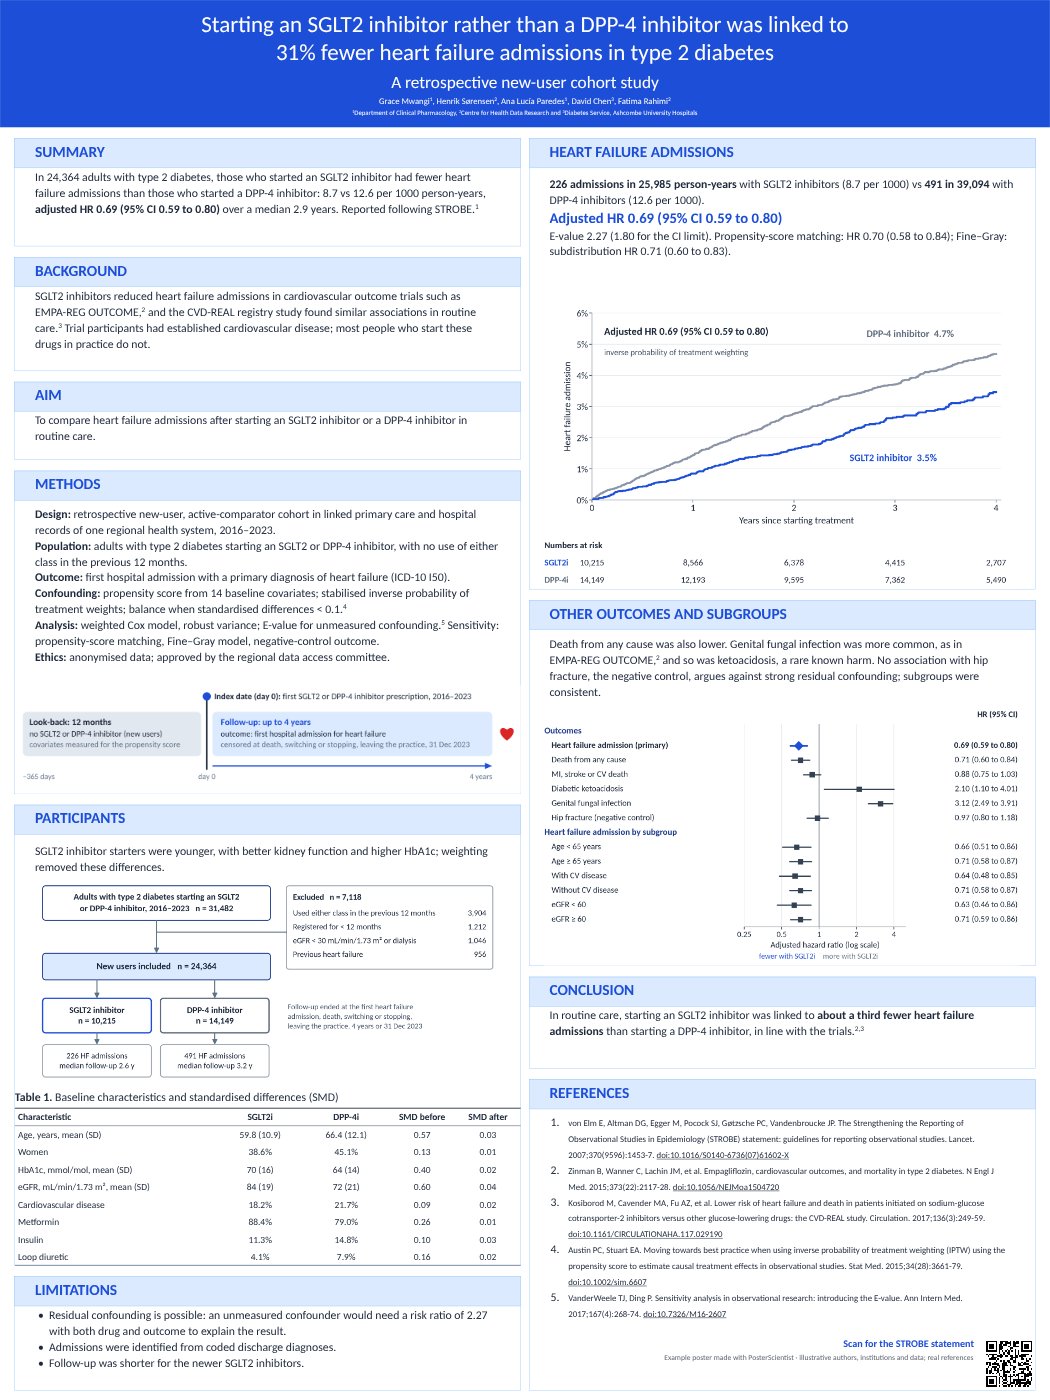
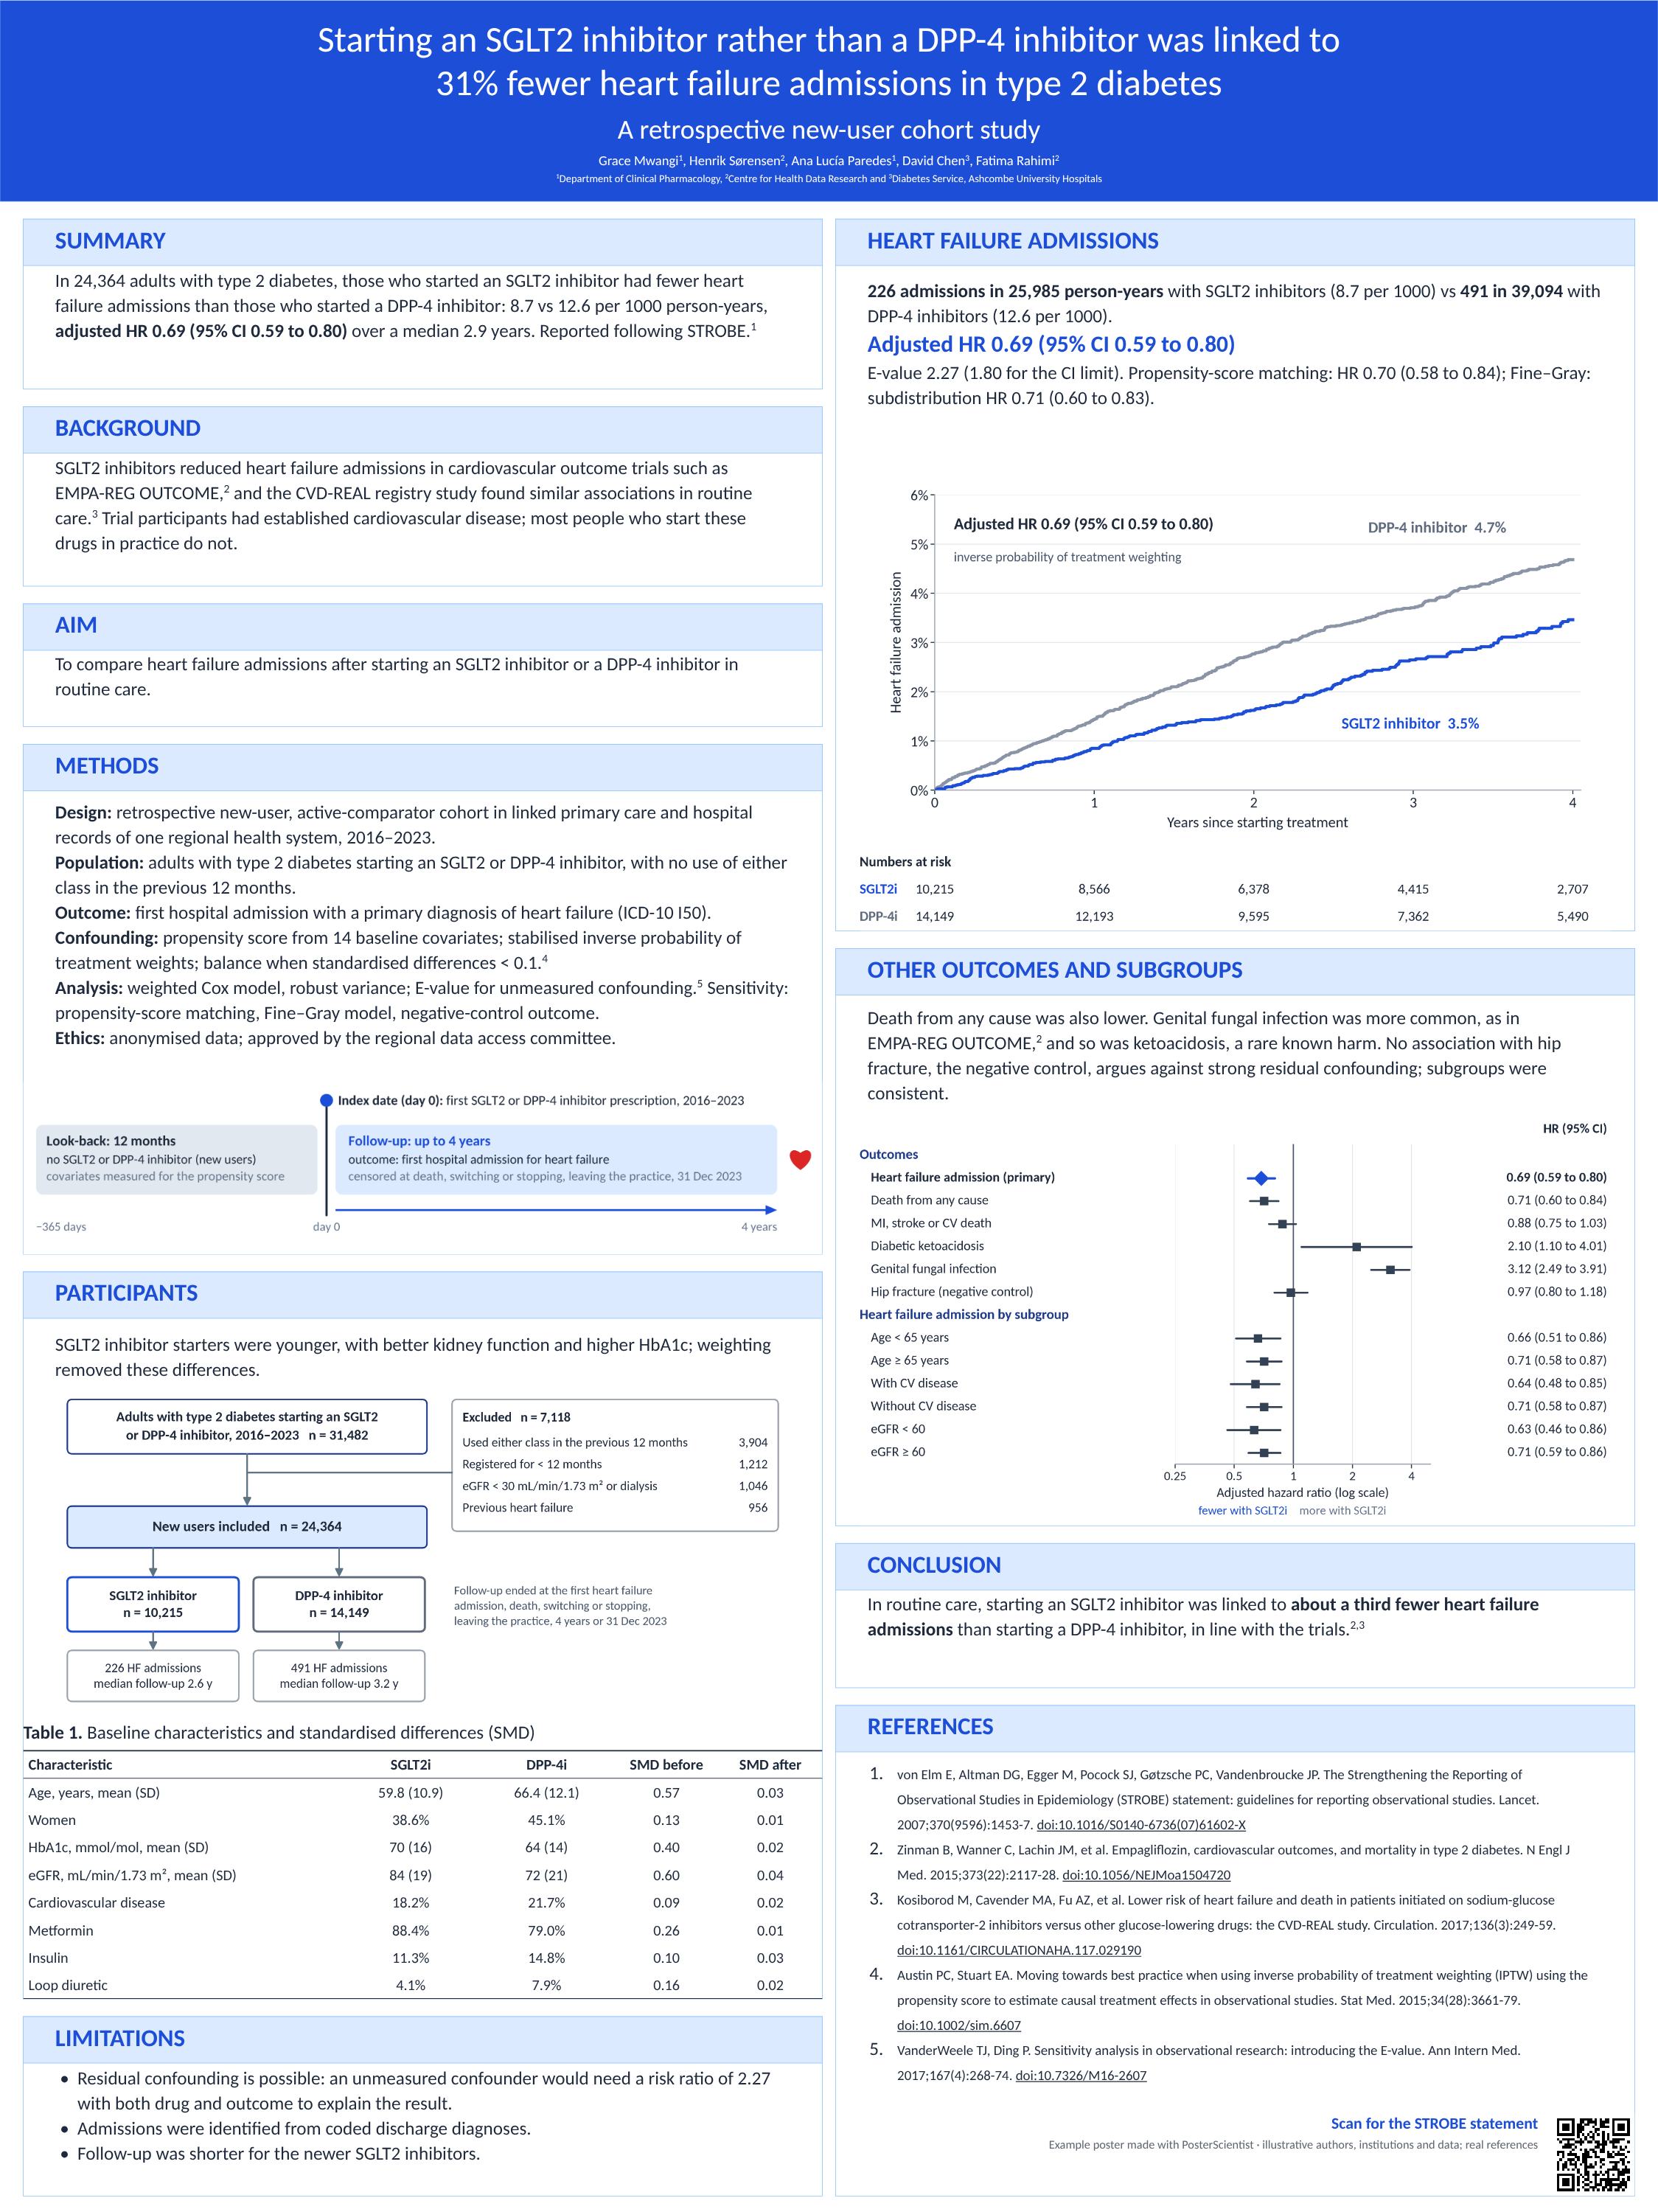
Starting an SGLT2 inhibitor rather than a DPP-4 inhibitor was linked to 31% fewer heart failure admissions in type 2 diabetes
Medicine · retrospective cohort study · Template: Classic Academic (Free) · 36 × 48 in portrait · Follows: STROBE: new-user active-comparator design, cohort flow diagram, baseline table with standardised differences, adjusted hazard ratio with 95% CI, Kaplan–Meier curve with numbers at risk
Why it works
An observational poster earns trust by showing its design. A design diagram (look-back, index date, follow-up) and a STROBE flow diagram that accounts for every excluded patient come first, and the baseline table shows the imbalance before weighting and the balance after it. The Kaplan–Meier curve carries the numbers at risk under its axis, the main effect is an adjusted hazard ratio with its 95% CI and an E-value, and the forest plot reports known harms and a negative-control outcome beside the benefits. The title says "linked to", not "caused".
References on the poster (Vancouver style)
- von Elm E, Altman DG, Egger M, Pocock SJ, Gøtzsche PC, Vandenbroucke JP. The Strengthening the Reporting of Observational Studies in Epidemiology (STROBE) statement: guidelines for reporting observational studies. Lancet. 2007;370(9596):1453-7. doi:10.1016/S0140-6736(07)61602-X
- Zinman B, Wanner C, Lachin JM, et al. Empagliflozin, cardiovascular outcomes, and mortality in type 2 diabetes. N Engl J Med. 2015;373(22):2117-28. doi:10.1056/NEJMoa1504720
- Kosiborod M, Cavender MA, Fu AZ, et al. Lower risk of heart failure and death in patients initiated on sodium-glucose cotransporter-2 inhibitors versus other glucose-lowering drugs: the CVD-REAL study. Circulation. 2017;136(3):249-59. doi:10.1161/CIRCULATIONAHA.117.029190
- Austin PC, Stuart EA. Moving towards best practice when using inverse probability of treatment weighting (IPTW) using the propensity score to estimate causal treatment effects in observational studies. Stat Med. 2015;34(28):3661-79. doi:10.1002/sim.6607
- VanderWeele TJ, Ding P. Sensitivity analysis in observational research: introducing the E-value. Ann Intern Med. 2017;167(4):268-74. doi:10.7326/M16-2607
Download PowerPoint · Open in editor · Use this template
-
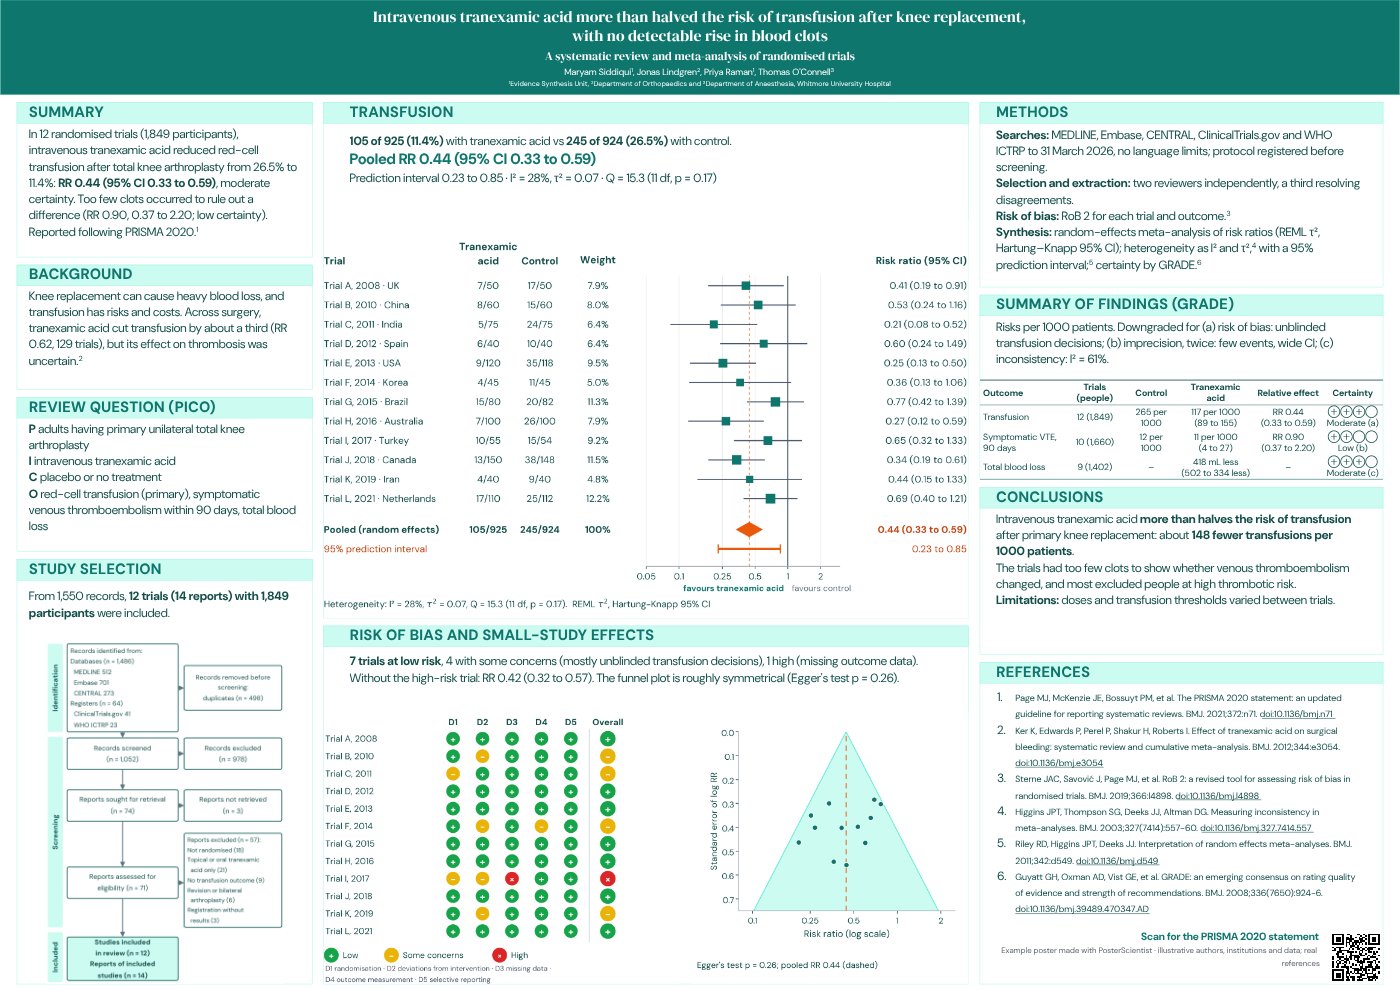
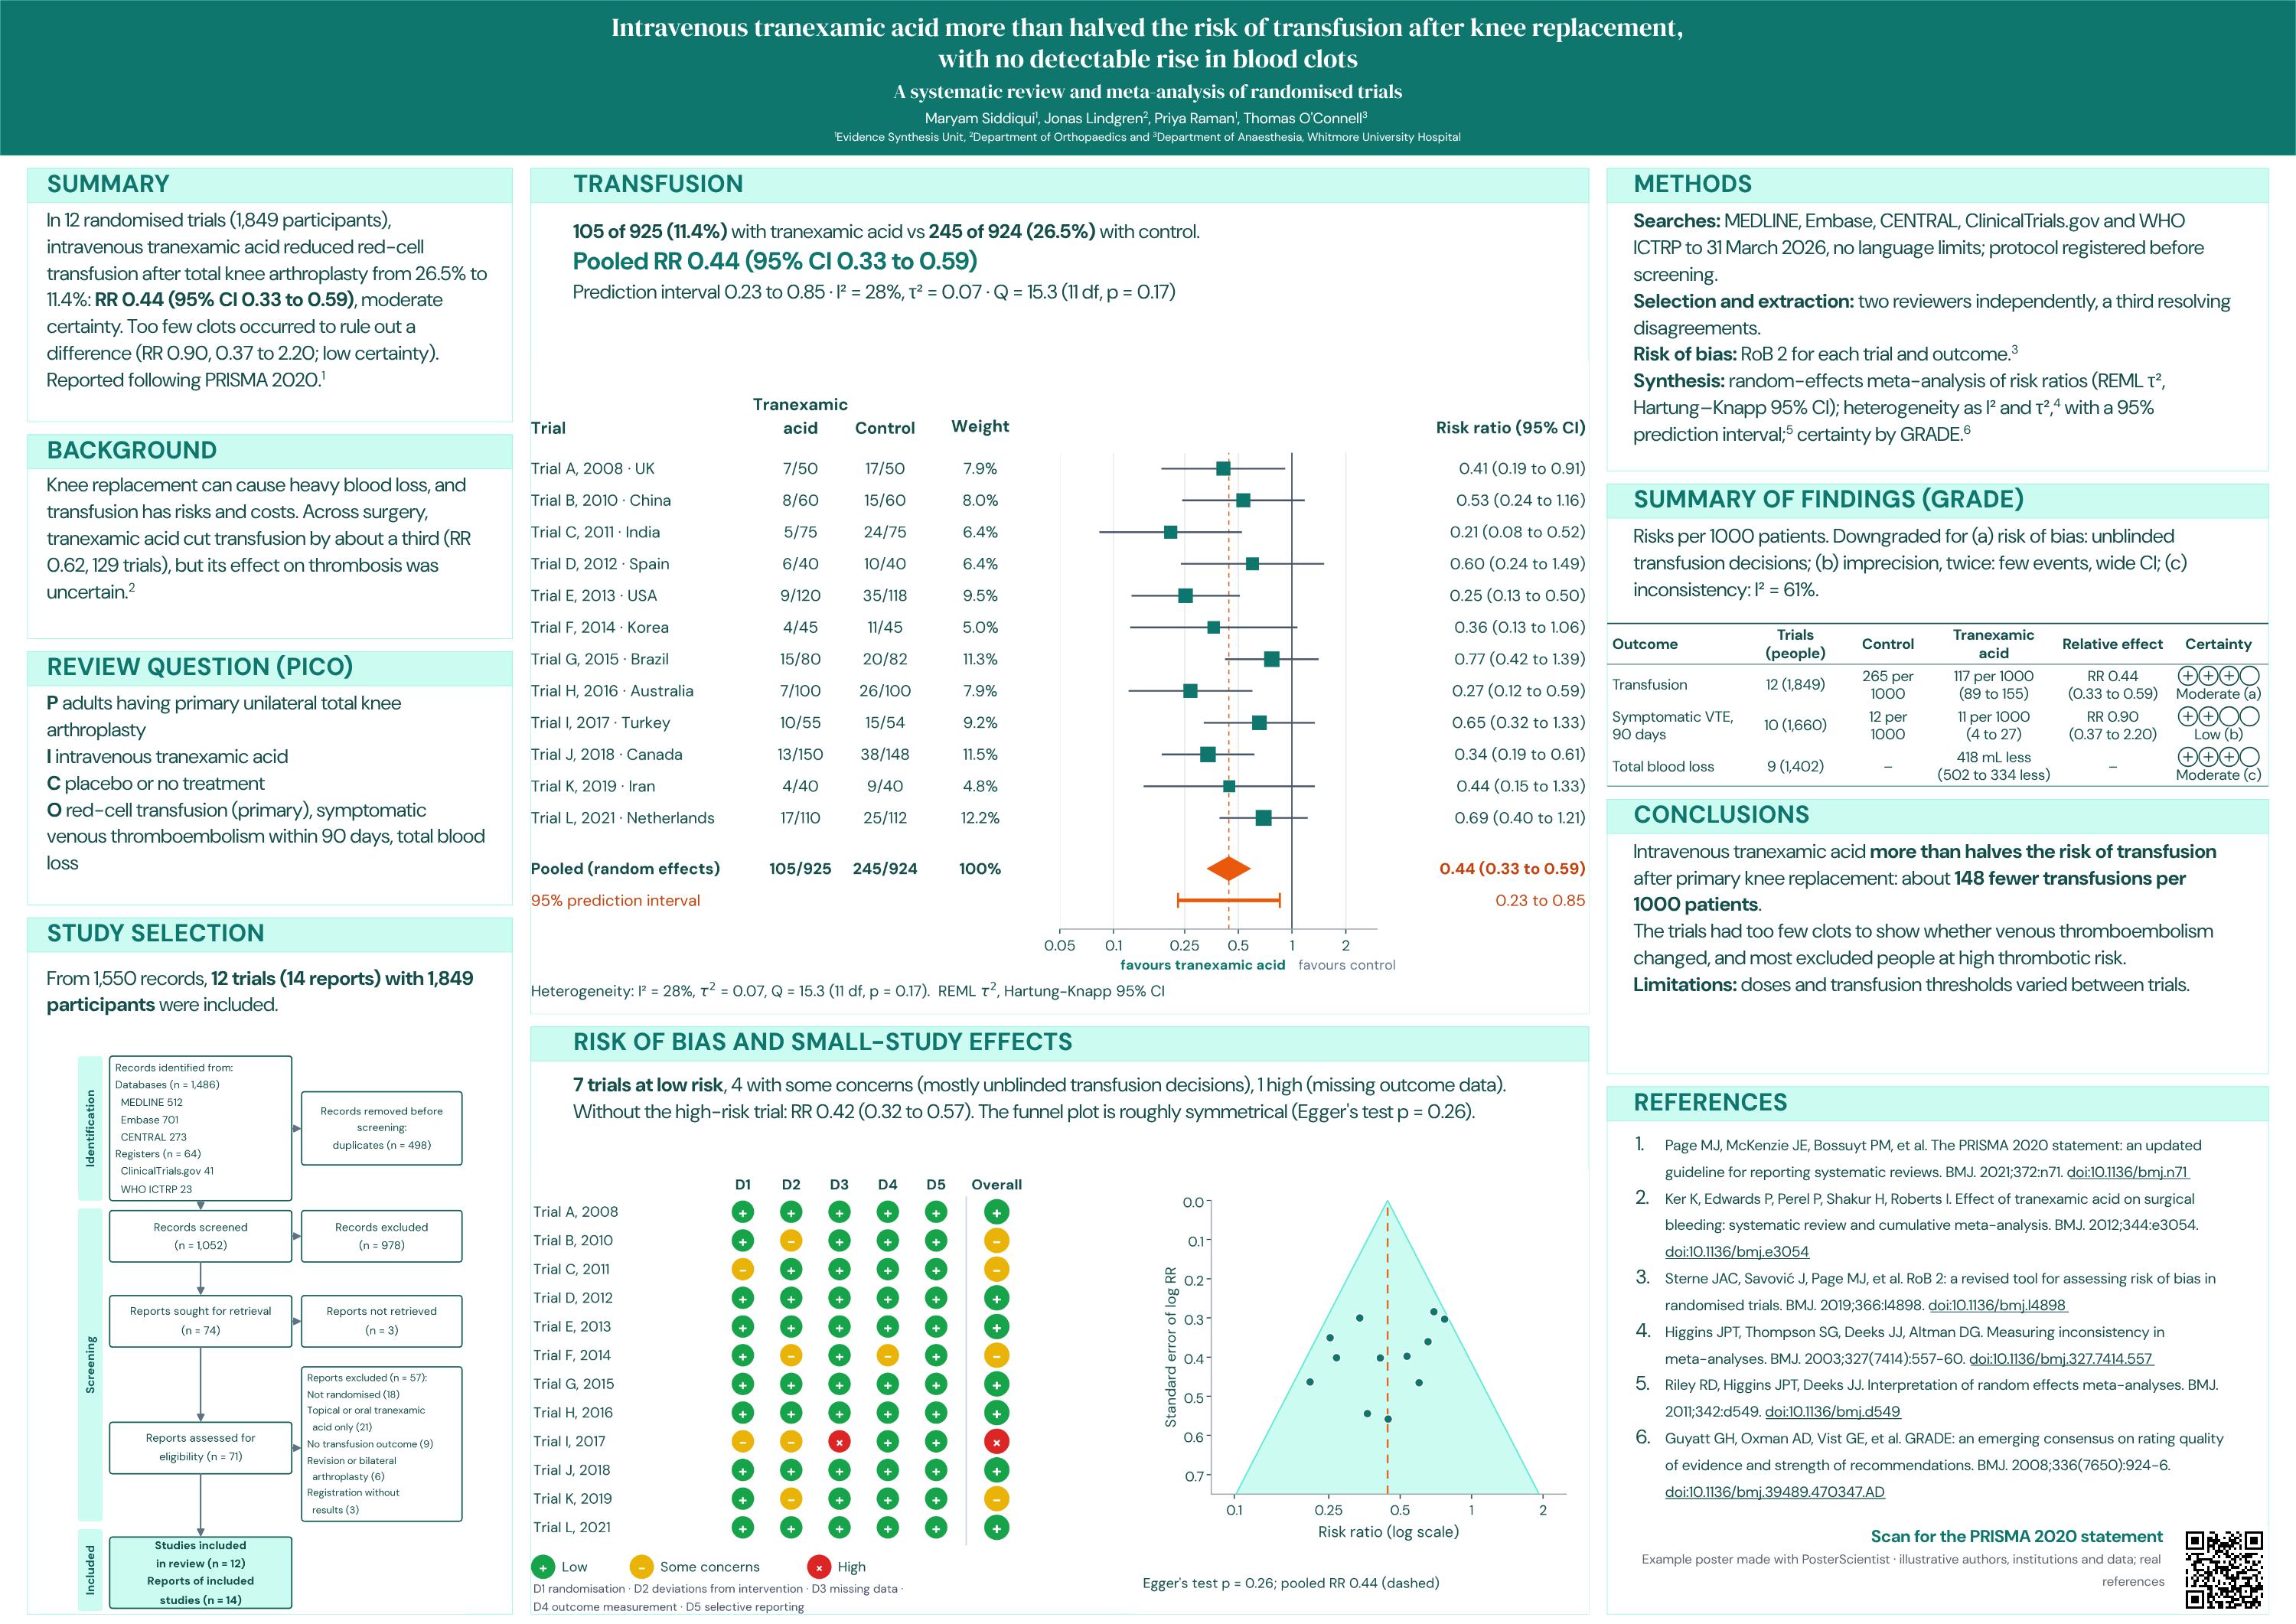
Intravenous tranexamic acid more than halved the risk of transfusion after knee replacement, with no detectable rise in blood clots
Medicine · systematic review and meta-analysis · Template: Modern Infographic (Free) · A0 Wide landscape (1189 × 841 mm) · Follows: PRISMA 2020: flow diagram, RoB 2 risk of bias, random-effects meta-analysis with I², τ² and a prediction interval, GRADE certainty of evidence
Why it works
The PRISMA 2020 flow diagram accounts for every record from search to inclusion, and each count follows from the one above it. The forest plot gives each trial's events, weight and risk ratio, then the pooled estimate with its 95% CI and prediction interval, with I² and τ² beside it. Risk of bias is a RoB 2 traffic-light chart by domain, a funnel plot with Egger's test checks small-study effects, and the GRADE summary of findings turns relative effects into numbers per 1000 patients with a certainty rating for each outcome. Trials are labelled A to L because the data are illustrative.
References on the poster (Vancouver style)
- Page MJ, McKenzie JE, Bossuyt PM, et al. The PRISMA 2020 statement: an updated guideline for reporting systematic reviews. BMJ. 2021;372:n71. doi:10.1136/bmj.n71
- Ker K, Edwards P, Perel P, Shakur H, Roberts I. Effect of tranexamic acid on surgical bleeding: systematic review and cumulative meta-analysis. BMJ. 2012;344:e3054. doi:10.1136/bmj.e3054
- Sterne JAC, Savović J, Page MJ, et al. RoB 2: a revised tool for assessing risk of bias in randomised trials. BMJ. 2019;366:l4898. doi:10.1136/bmj.l4898
- Higgins JPT, Thompson SG, Deeks JJ, Altman DG. Measuring inconsistency in meta-analyses. BMJ. 2003;327(7414):557-60. doi:10.1136/bmj.327.7414.557
- Riley RD, Higgins JPT, Deeks JJ. Interpretation of random effects meta-analyses. BMJ. 2011;342:d549. doi:10.1136/bmj.d549
- Guyatt GH, Oxman AD, Vist GE, et al. GRADE: an emerging consensus on rating quality of evidence and strength of recommendations. BMJ. 2008;336(7650):924-6. doi:10.1136/bmj.39489.470347.AD
Download PowerPoint · Open in editor · Use this template
-
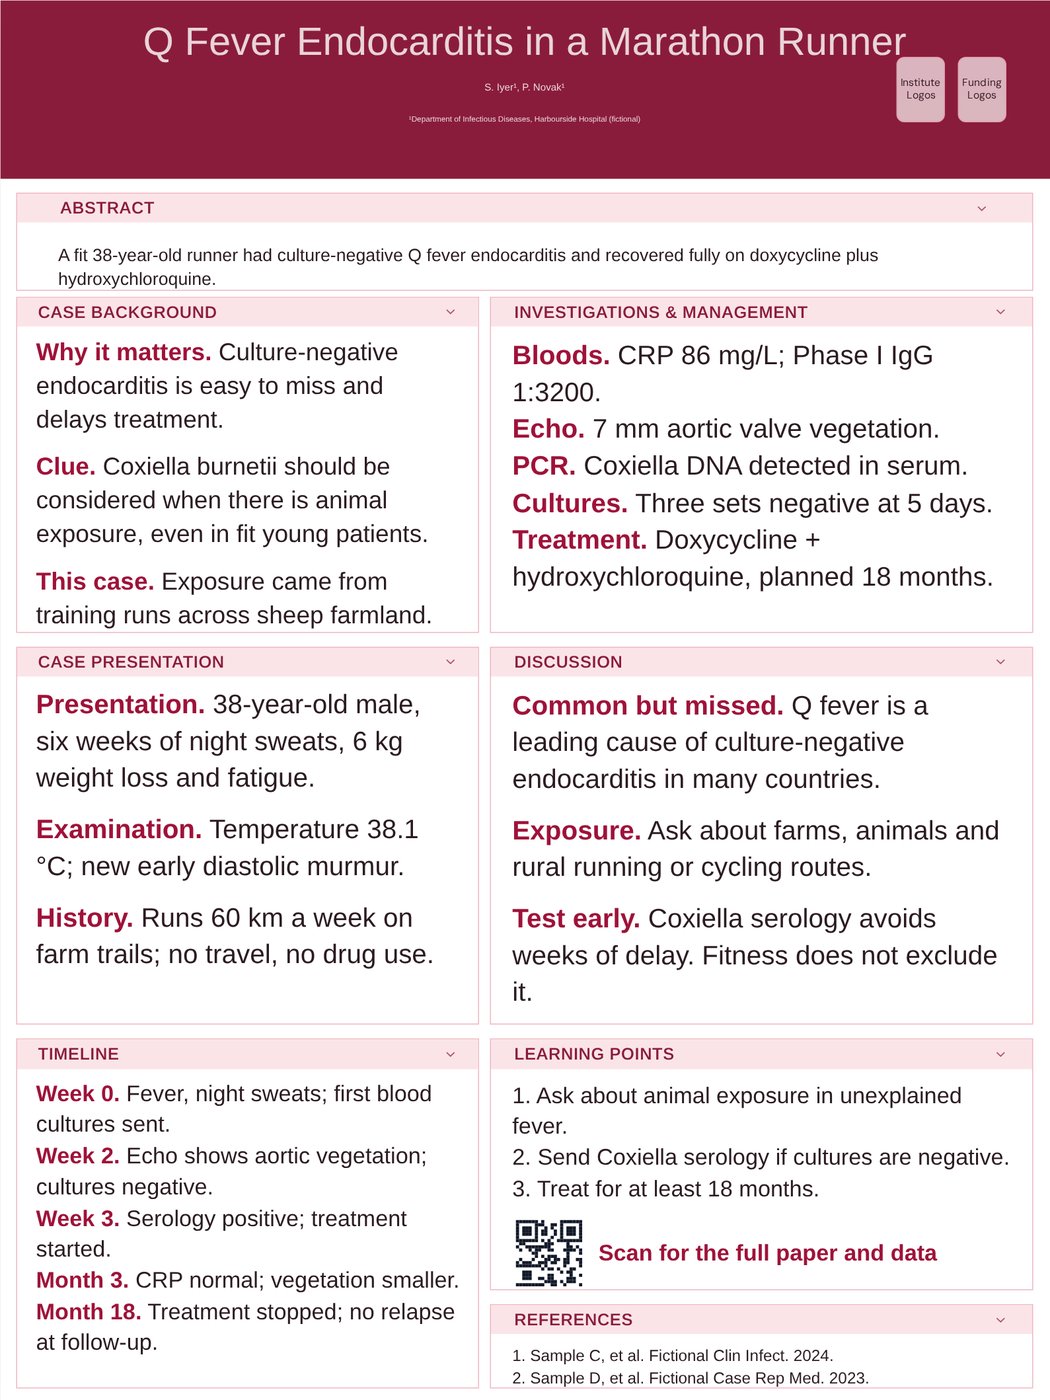
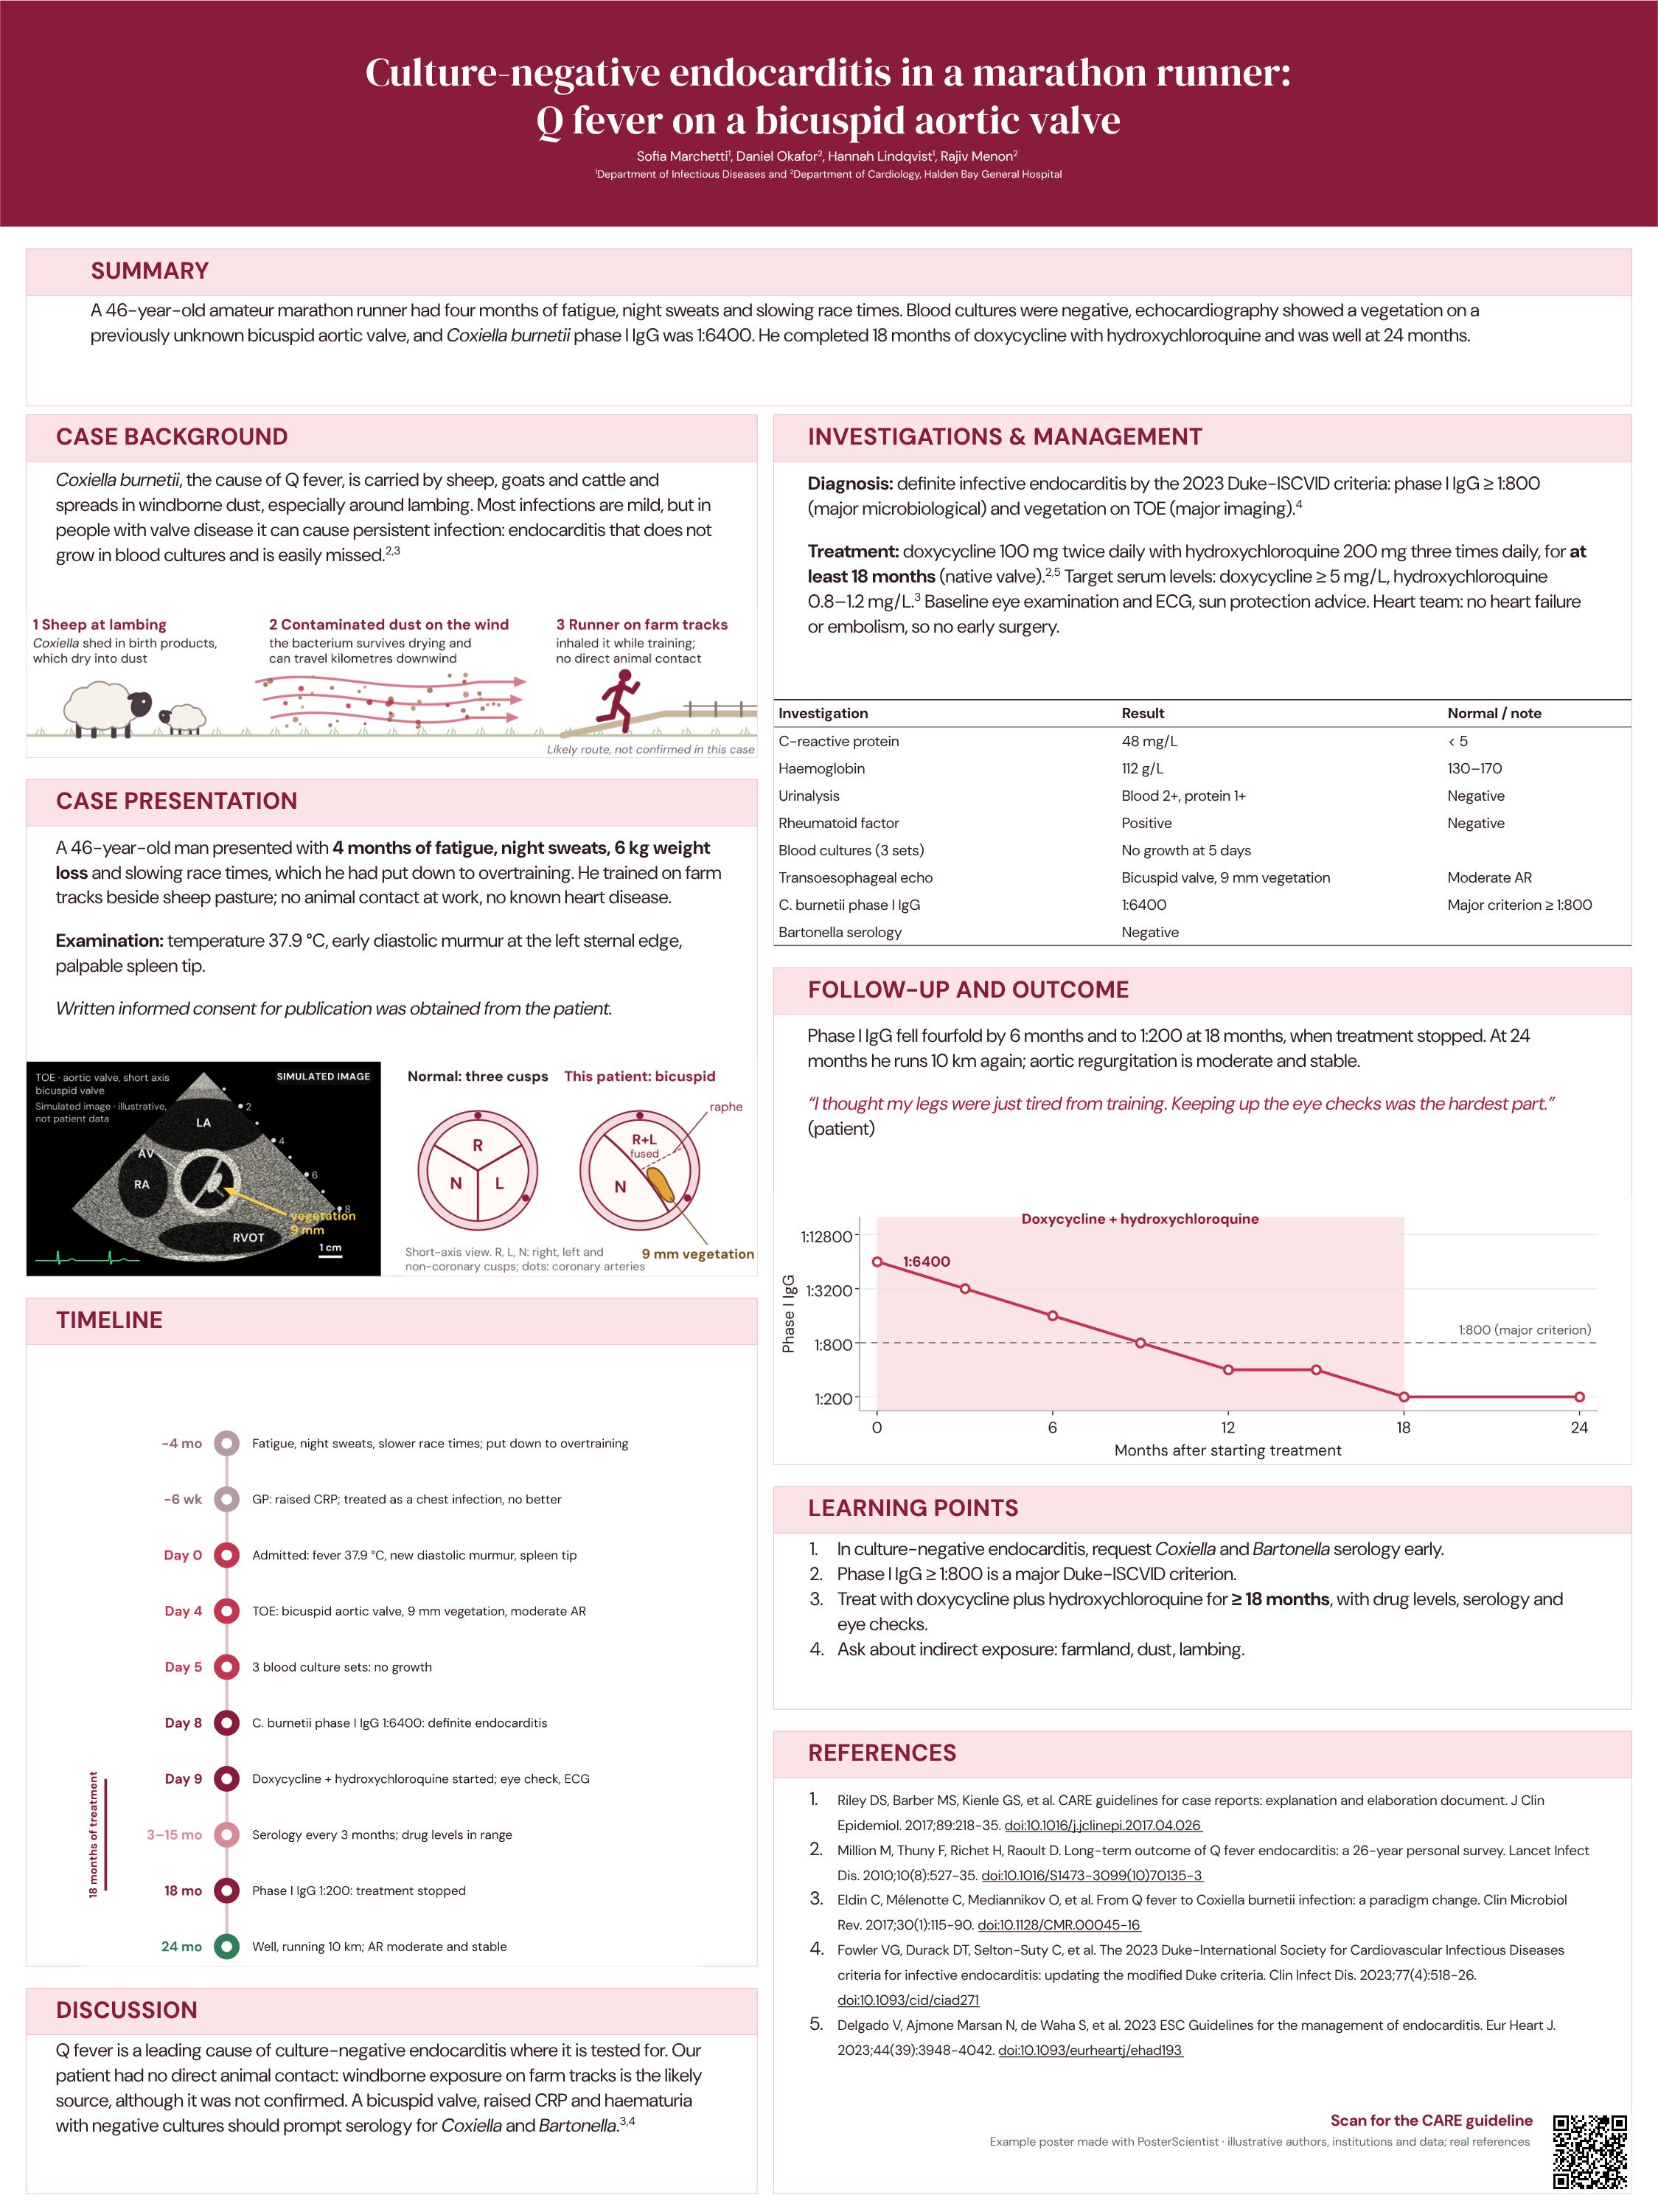
Culture-negative endocarditis in a marathon runner: Q fever on a bicuspid aortic valve
Medicine · clinical case report · Template: Case Report (Free) · 36 × 48 in portrait · Follows: CARE checklist: timeline, diagnostic reasoning, treatment, follow-up, patient perspective, consent
Why it works
A case poster tells the clinical story in CARE order. The timeline and the falling phase I antibody titre carry the narrative, the investigations sit in a compact table, and the treatment follows current guidance (doxycycline with hydroxychloroquine for at least 18 months, with drug-level and eye monitoring). Learning points are numbered because they are what visitors photograph. Drawings show what readers may not picture: how a runner can catch Q fever without touching a sheep, and how a bicuspid valve differs from a normal one. The echo still is a simulated image, labelled as such, with the vegetation arrowed and a 1 cm scale bar.
References on the poster (Vancouver style)
- Riley DS, Barber MS, Kienle GS, et al. CARE guidelines for case reports: explanation and elaboration document. J Clin Epidemiol. 2017;89:218-35. doi:10.1016/j.jclinepi.2017.04.026
- Million M, Thuny F, Richet H, Raoult D. Long-term outcome of Q fever endocarditis: a 26-year personal survey. Lancet Infect Dis. 2010;10(8):527-35. doi:10.1016/S1473-3099(10)70135-3
- Eldin C, Mélenotte C, Mediannikov O, et al. From Q fever to Coxiella burnetii infection: a paradigm change. Clin Microbiol Rev. 2017;30(1):115-90. doi:10.1128/CMR.00045-16
- Fowler VG, Durack DT, Selton-Suty C, et al. The 2023 Duke-International Society for Cardiovascular Infectious Diseases criteria for infective endocarditis: updating the modified Duke criteria. Clin Infect Dis. 2023;77(4):518-26. doi:10.1093/cid/ciad271
- Delgado V, Ajmone Marsan N, de Waha S, et al. 2023 ESC Guidelines for the management of endocarditis. Eur Heart J. 2023;44(39):3948-4042. doi:10.1093/eurheartj/ehad193
Download PowerPoint · Open in editor · Use this template
-
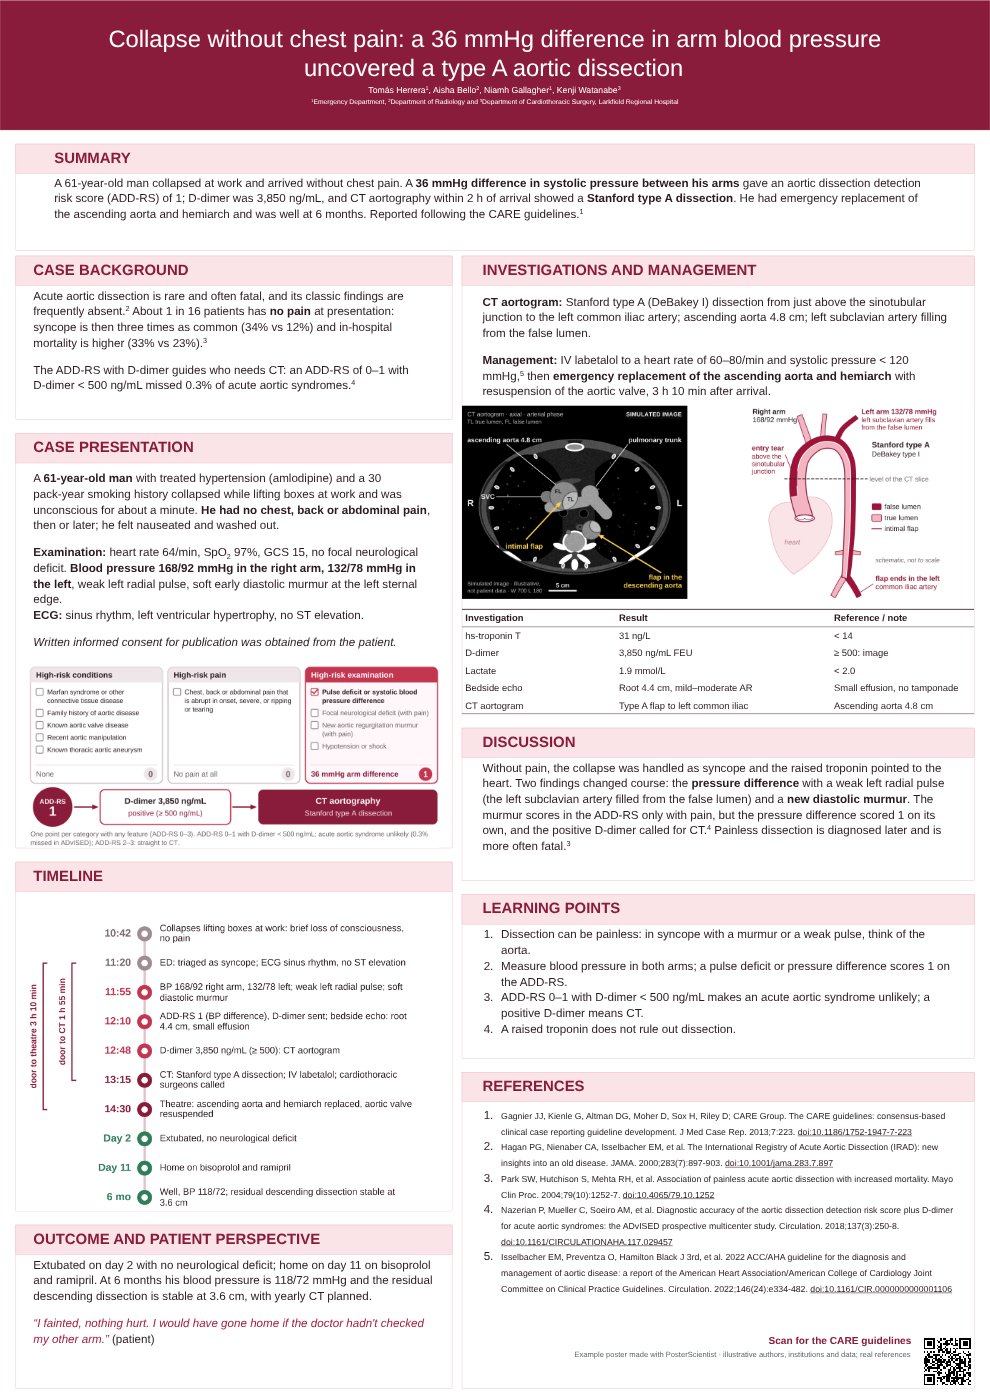
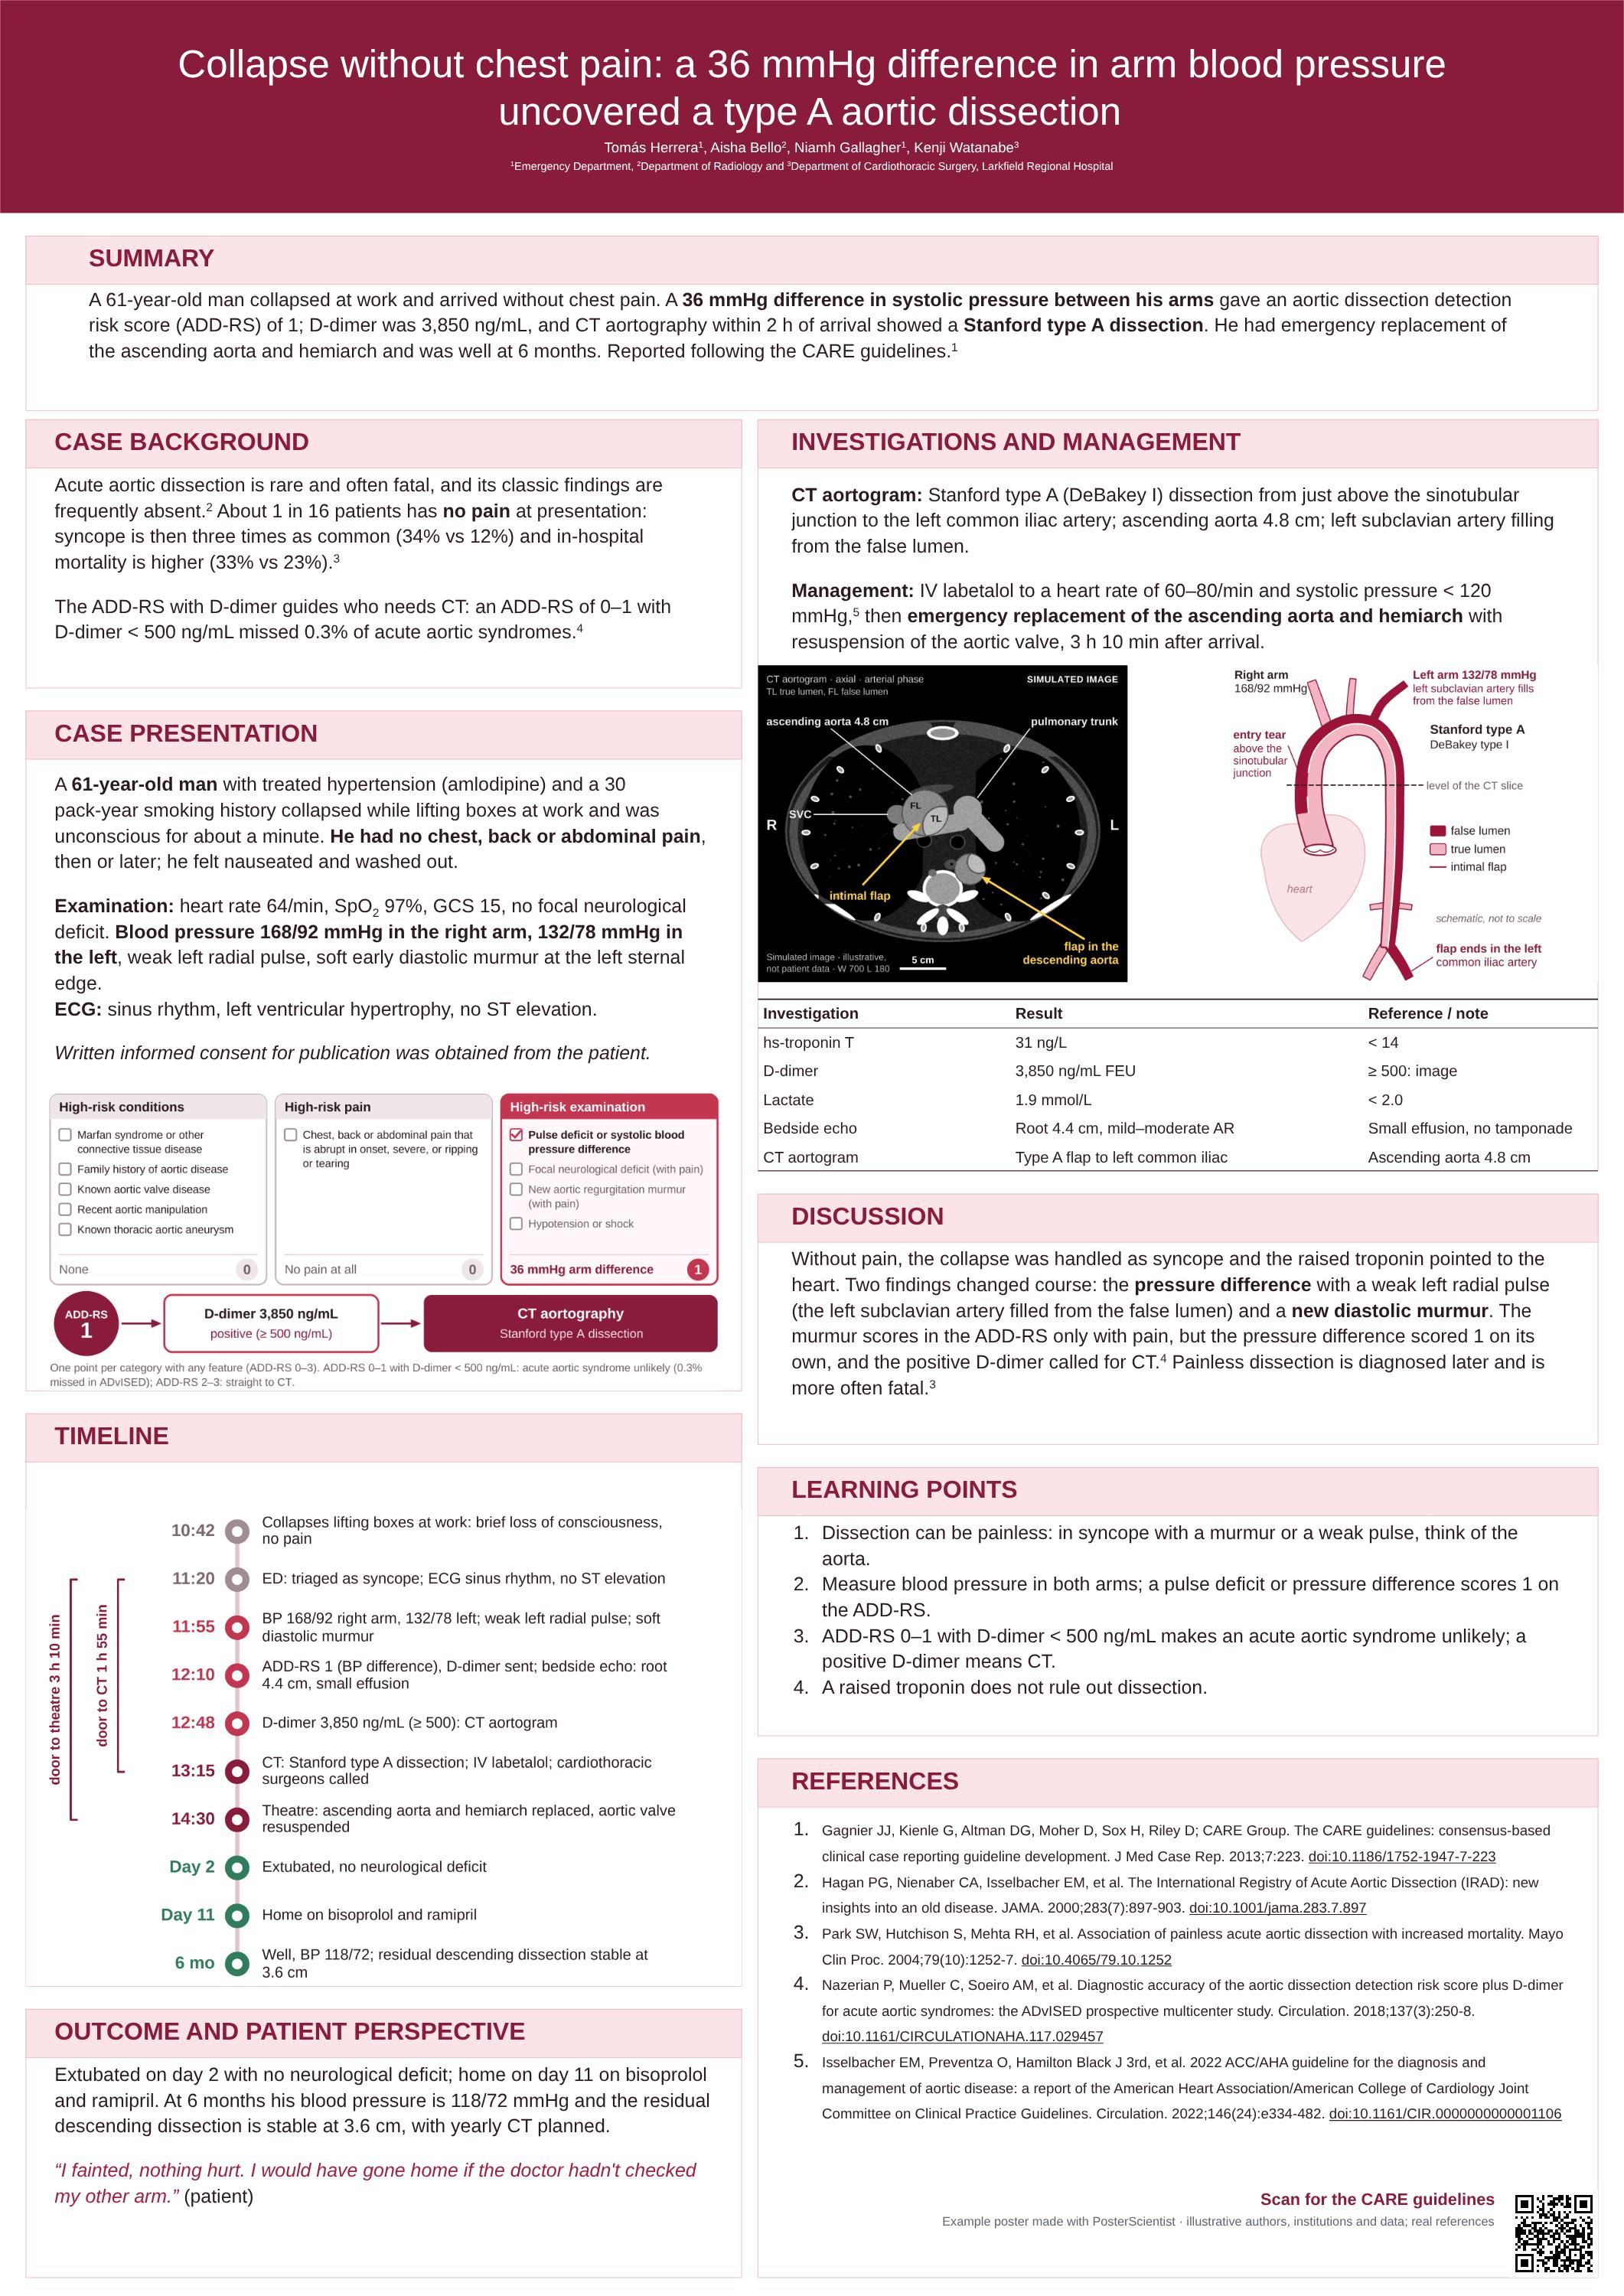
Collapse without chest pain: a 36 mmHg difference in arm blood pressure uncovered a type A aortic dissection
Medicine · emergency medicine case report · Template: Case Report (Free) · A0 portrait (841 × 1189 mm) · Follows: CARE checklist: timeline, diagnostic reasoning with a validated risk score, imaging, treatment, outcome, patient perspective, consent
Why it works
The title names the clue that made the diagnosis. The timeline runs in clock times, because in an emergency case the minutes are the story, and the diagnostic reasoning is drawn as the ADD-RS plus D-dimer pathway with this patient's answers filled in. A drawing of the aorta shows how far the dissection ran and why the left arm pressure was low, and the CT slice (a simulated image, labelled as such, with an orientation marker and a 5 cm scale bar) shows the intimal flap in the ascending and descending aorta. Learning points are numbered because they are what visitors photograph.
References on the poster (Vancouver style)
- Gagnier JJ, Kienle G, Altman DG, Moher D, Sox H, Riley D; CARE Group. The CARE guidelines: consensus-based clinical case reporting guideline development. J Med Case Rep. 2013;7:223. doi:10.1186/1752-1947-7-223
- Hagan PG, Nienaber CA, Isselbacher EM, et al. The International Registry of Acute Aortic Dissection (IRAD): new insights into an old disease. JAMA. 2000;283(7):897-903. doi:10.1001/jama.283.7.897
- Park SW, Hutchison S, Mehta RH, et al. Association of painless acute aortic dissection with increased mortality. Mayo Clin Proc. 2004;79(10):1252-7. doi:10.4065/79.10.1252
- Nazerian P, Mueller C, Soeiro AM, et al. Diagnostic accuracy of the aortic dissection detection risk score plus D-dimer for acute aortic syndromes: the ADvISED prospective multicenter study. Circulation. 2018;137(3):250-8. doi:10.1161/CIRCULATIONAHA.117.029457
- Isselbacher EM, Preventza O, Hamilton Black J 3rd, et al. 2022 ACC/AHA guideline for the diagnosis and management of aortic disease: a report of the American Heart Association/American College of Cardiology Joint Committee on Clinical Practice Guidelines. Circulation. 2022;146(24):e334-482. doi:10.1161/CIR.0000000000001106
Download PowerPoint · Open in editor · Use this template
-
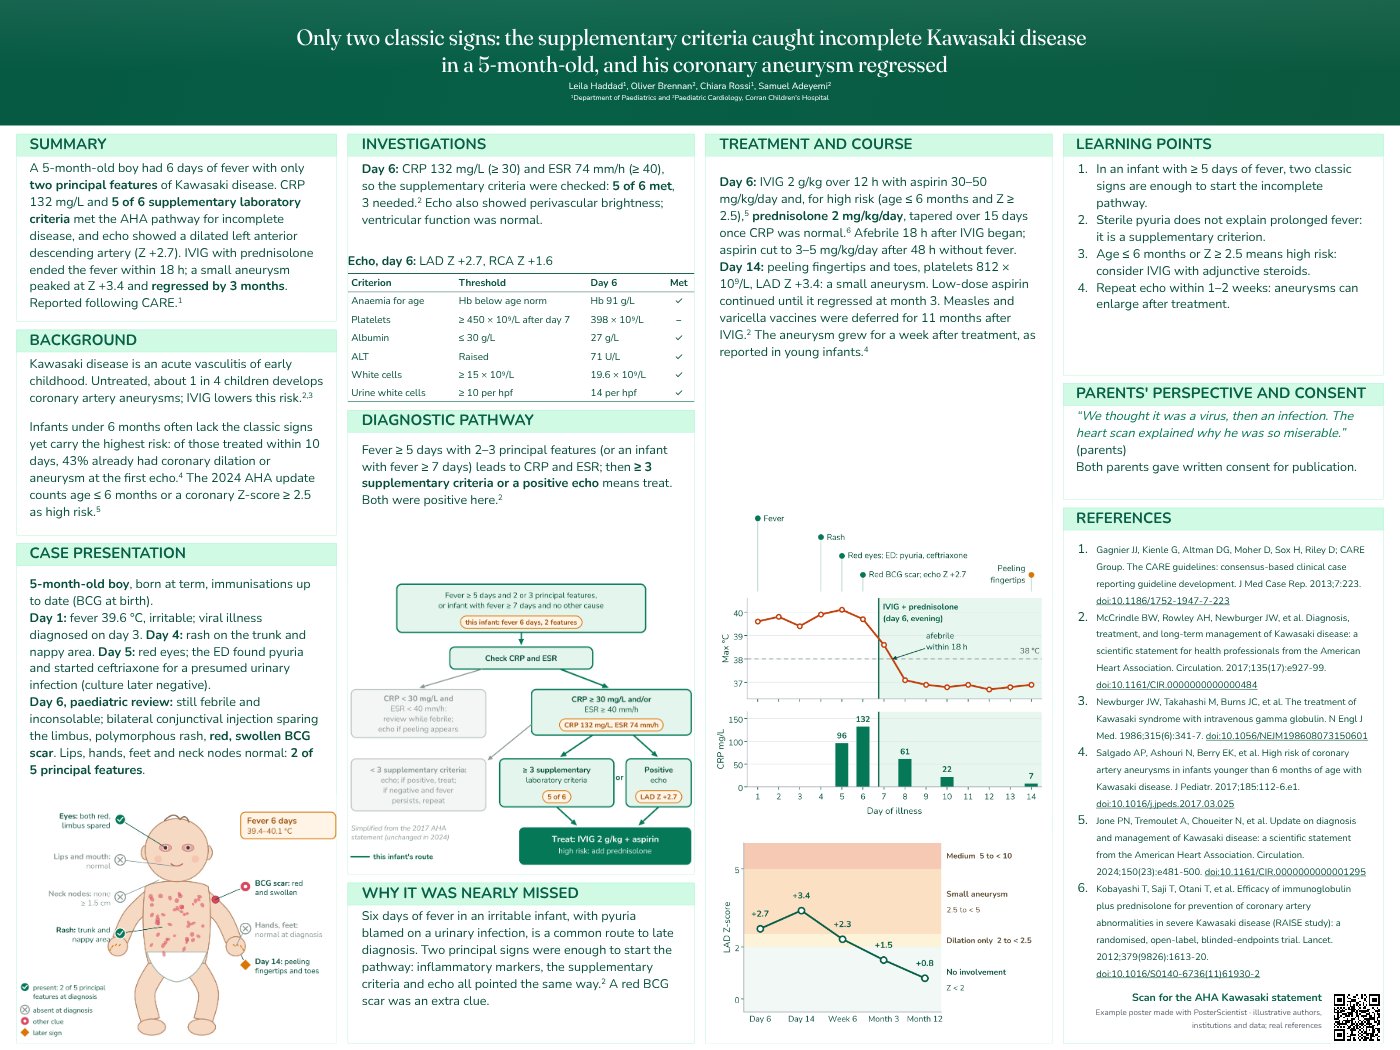
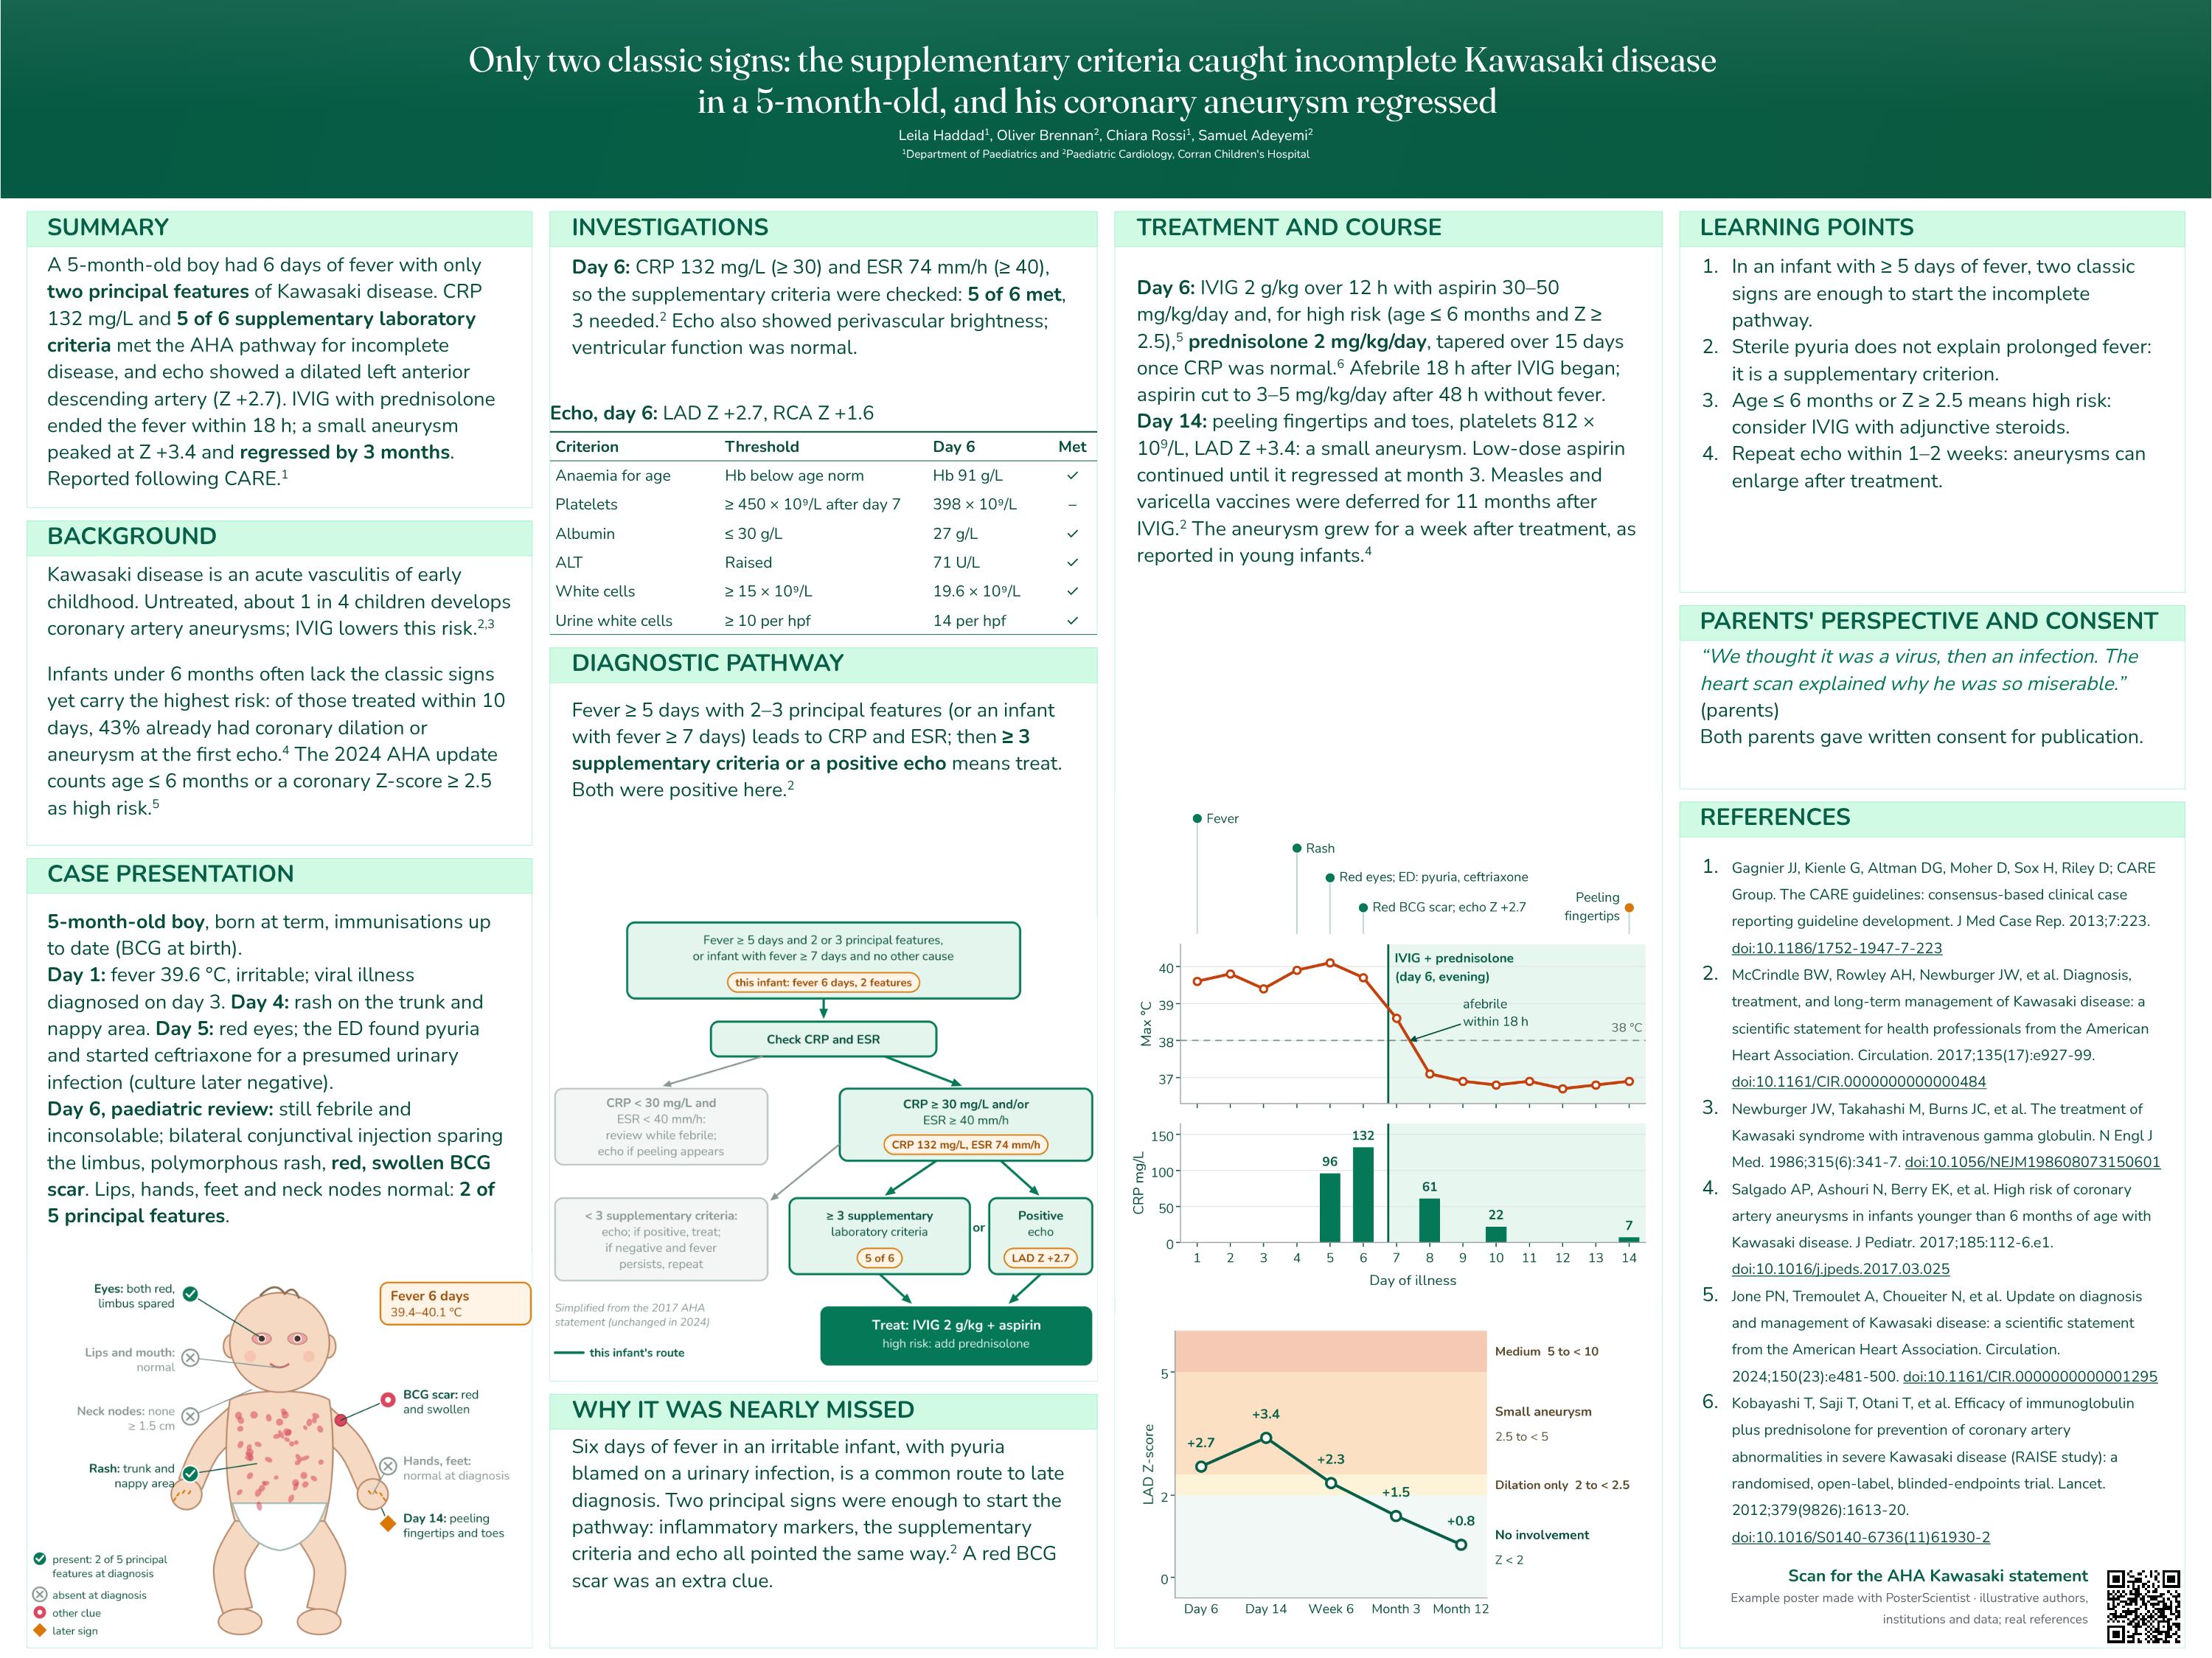
Only two classic signs: the supplementary criteria caught incomplete Kawasaki disease in a 5-month-old, and his coronary aneurysm regressed
Medicine · paediatric case report · Template: Poster Session (Free) · 48 × 36 in landscape · Follows: CARE checklist with the AHA incomplete Kawasaki disease pathway: timeline, criteria met, treatment, coronary Z-score follow-up, parents' perspective, consent
Why it works
Incomplete Kawasaki disease is missed because the classic signs are missing, so the poster shows exactly which ones were there. A drawn infant body map marks the five principal features (two present, three absent at diagnosis), the red BCG scar and the peeling fingertips of week 2, and the AHA pathway is drawn with this infant's route through it highlighted. The supplementary laboratory criteria sit in a table with each threshold beside the result, the timeline plots fever and CRP against the treatment, and the coronary Z-score chart shows follow-up against the AHA classification bands.
References on the poster (Vancouver style)
- Gagnier JJ, Kienle G, Altman DG, Moher D, Sox H, Riley D; CARE Group. The CARE guidelines: consensus-based clinical case reporting guideline development. J Med Case Rep. 2013;7:223. doi:10.1186/1752-1947-7-223
- McCrindle BW, Rowley AH, Newburger JW, et al. Diagnosis, treatment, and long-term management of Kawasaki disease: a scientific statement for health professionals from the American Heart Association. Circulation. 2017;135(17):e927-99. doi:10.1161/CIR.0000000000000484
- Newburger JW, Takahashi M, Burns JC, et al. The treatment of Kawasaki syndrome with intravenous gamma globulin. N Engl J Med. 1986;315(6):341-7. doi:10.1056/NEJM198608073150601
- Salgado AP, Ashouri N, Berry EK, et al. High risk of coronary artery aneurysms in infants younger than 6 months of age with Kawasaki disease. J Pediatr. 2017;185:112-6.e1. doi:10.1016/j.jpeds.2017.03.025
- Jone PN, Tremoulet A, Choueiter N, et al. Update on diagnosis and management of Kawasaki disease: a scientific statement from the American Heart Association. Circulation. 2024;150(23):e481-500. doi:10.1161/CIR.0000000000001295
- Kobayashi T, Saji T, Otani T, et al. Efficacy of immunoglobulin plus prednisolone for prevention of coronary artery abnormalities in severe Kawasaki disease (RAISE study): a randomised, open-label, blinded-endpoints trial. Lancet. 2012;379(9826):1613-20. doi:10.1016/S0140-6736(11)61930-2
Download PowerPoint · Open in editor · Use this template
-
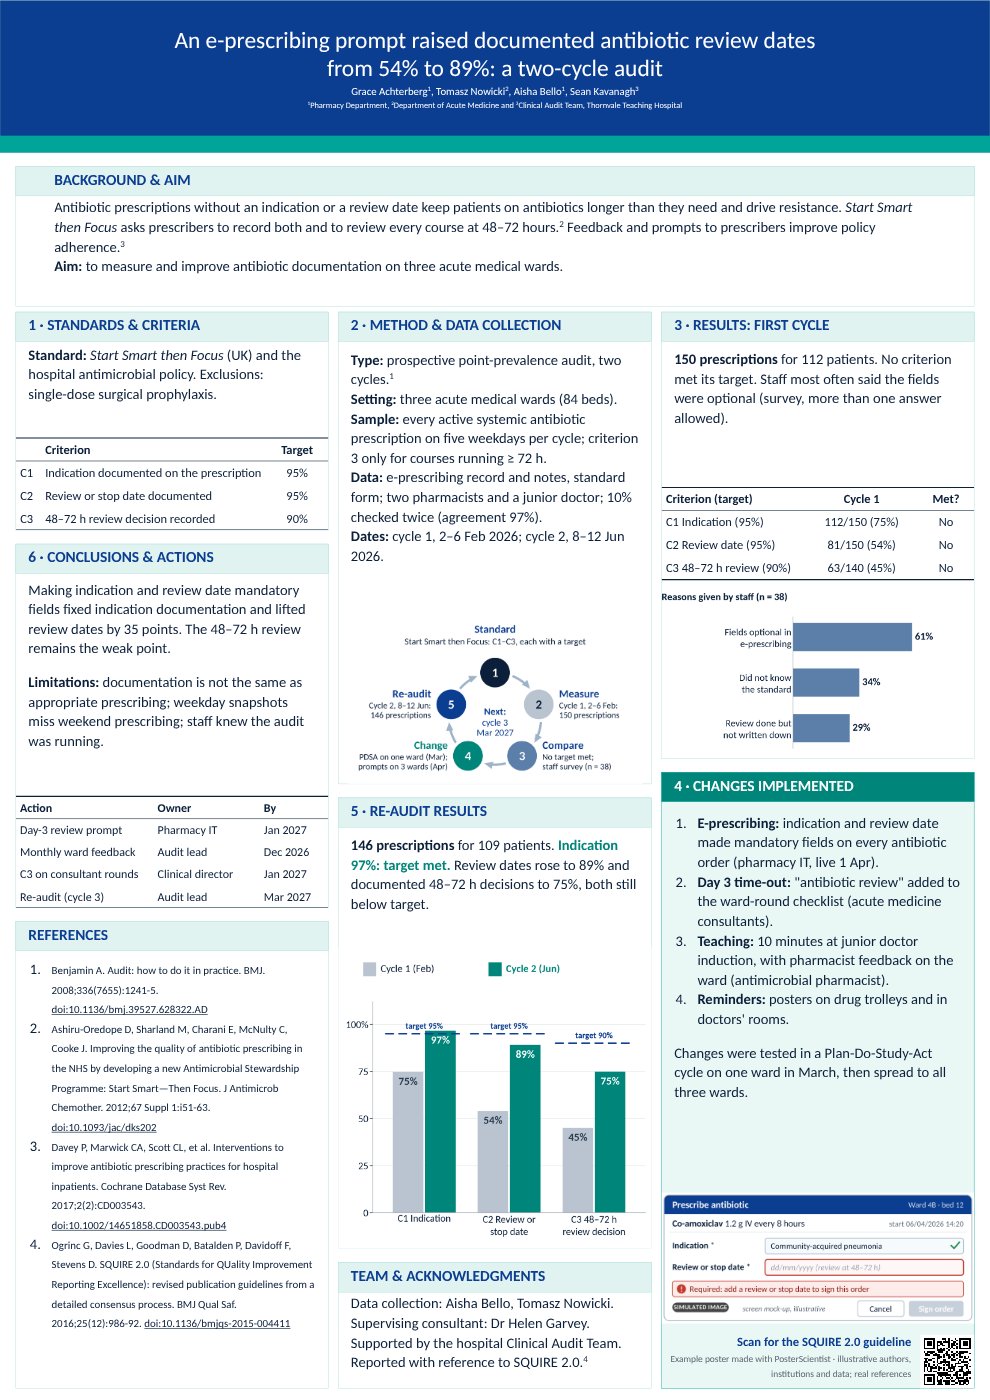
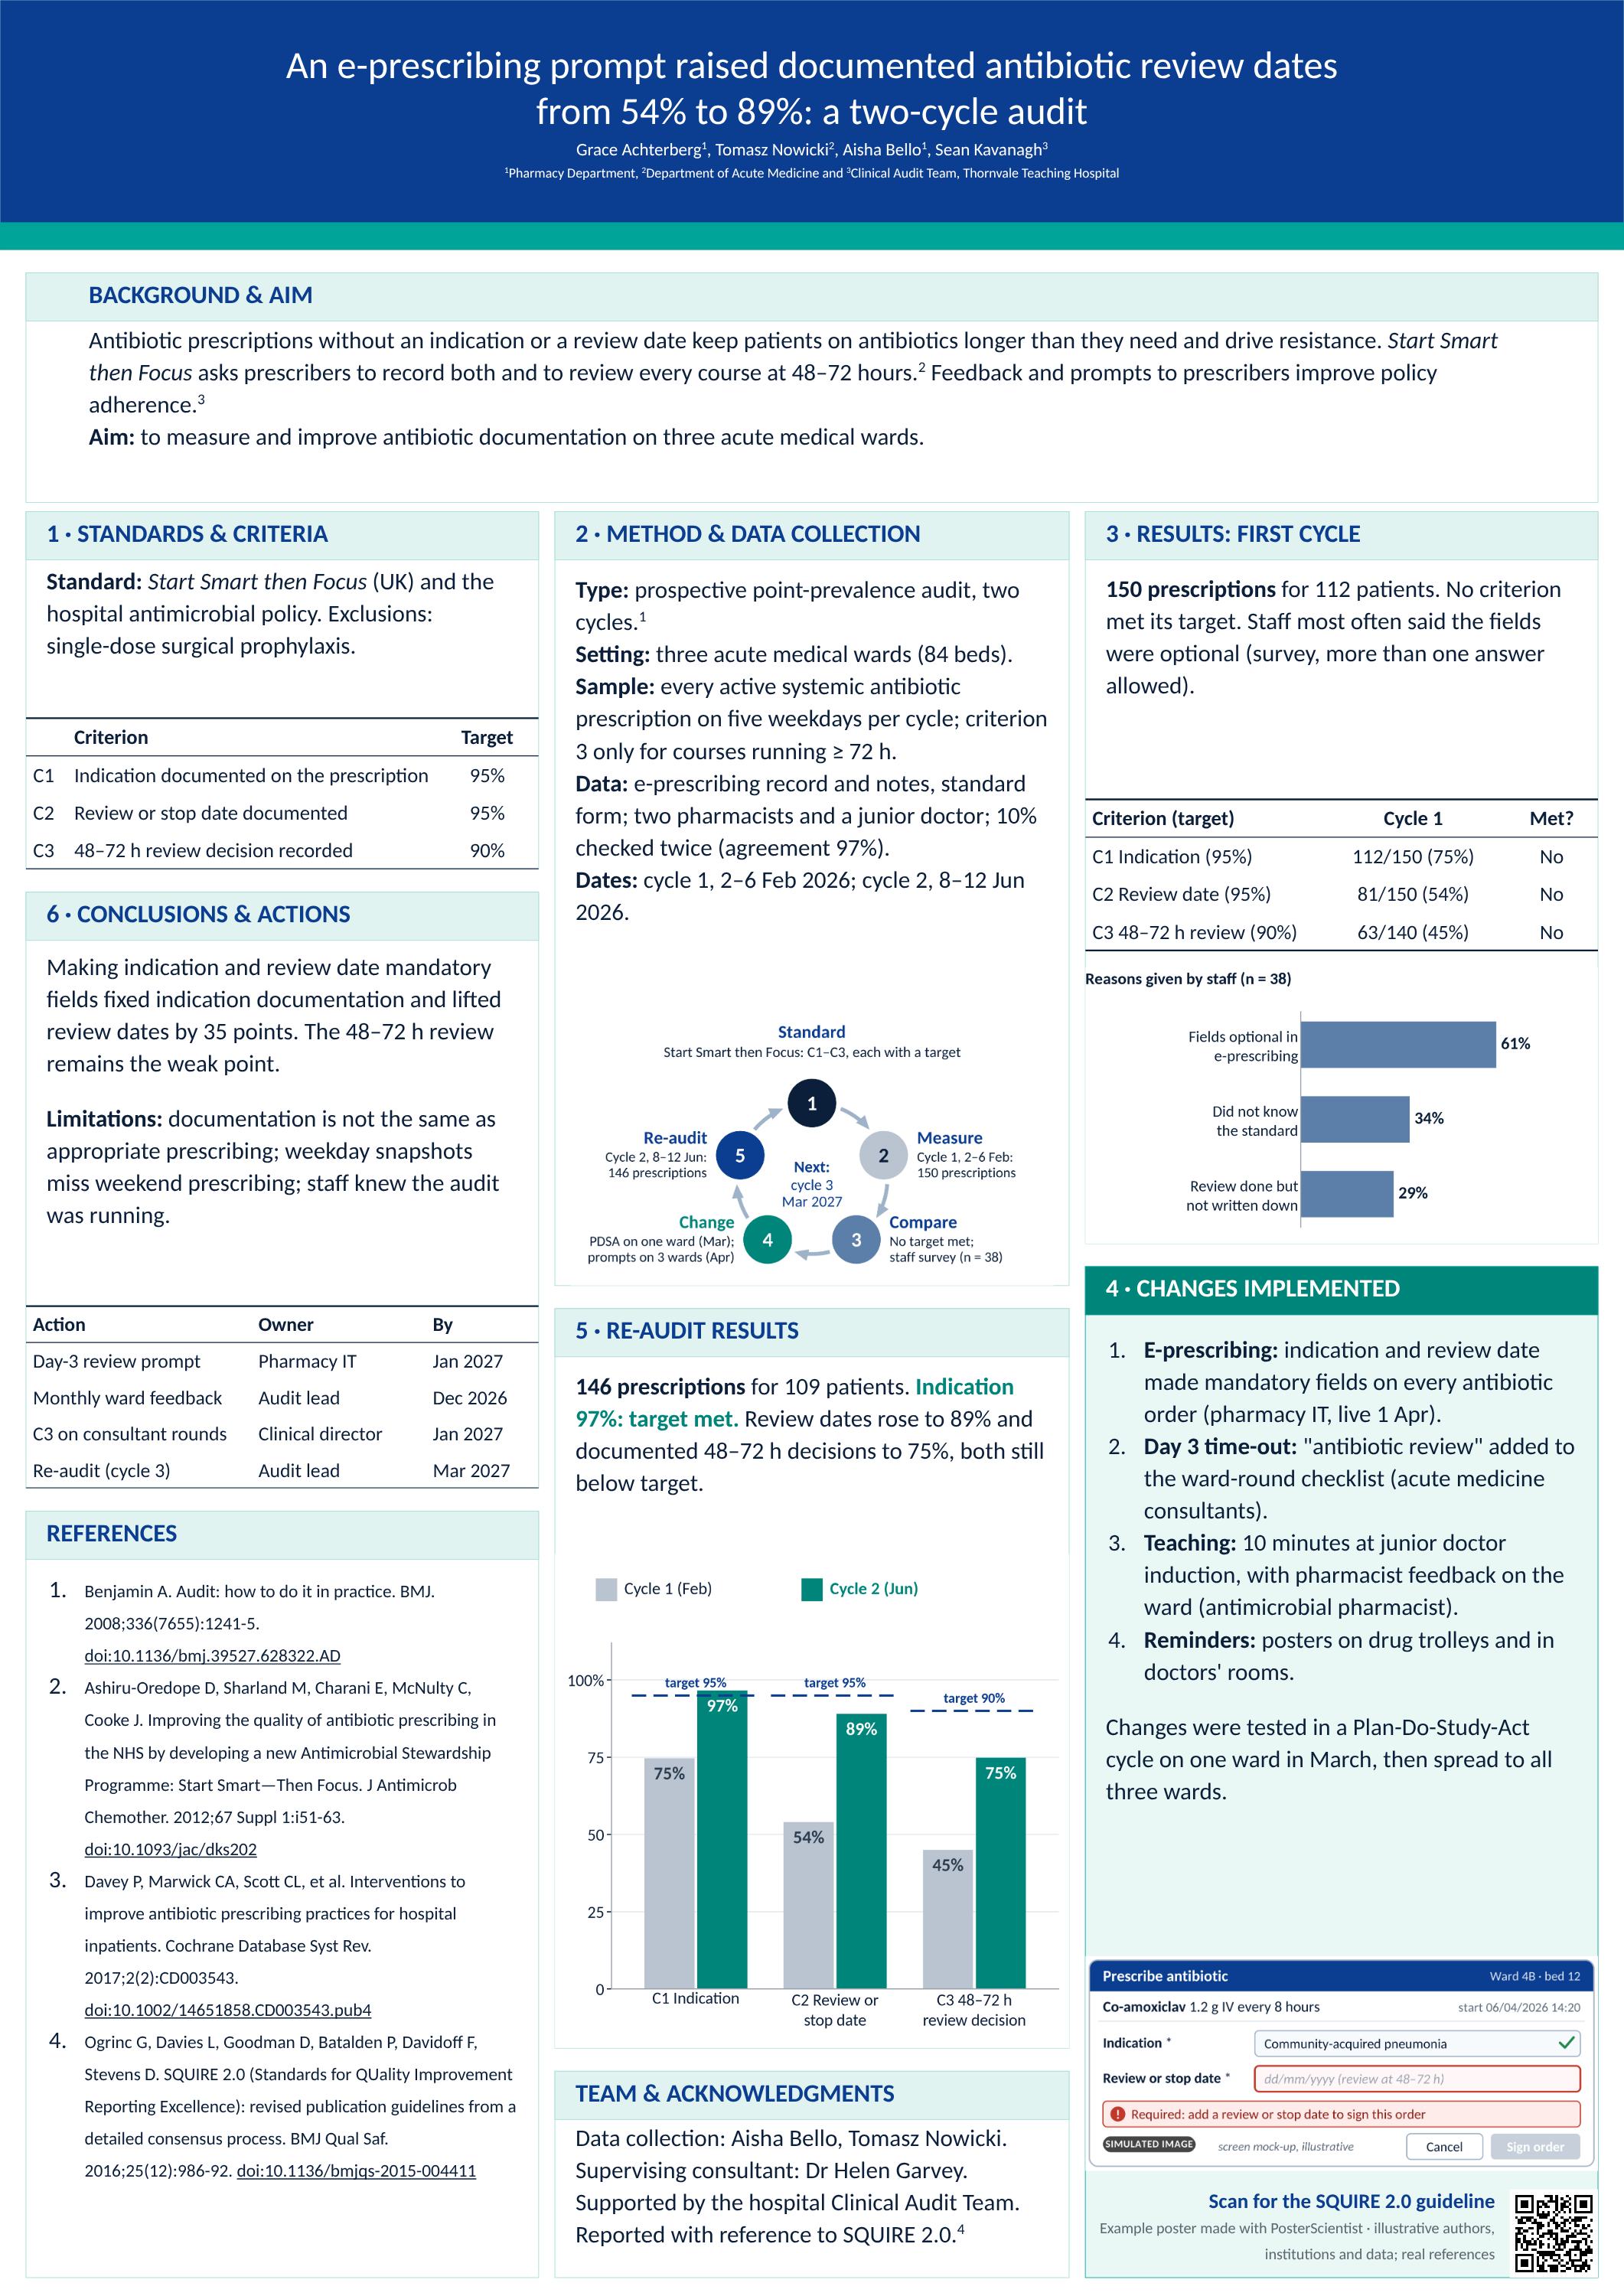
An e-prescribing prompt raised documented antibiotic review dates from 54% to 89%
Clinical audit · antimicrobial stewardship · Template: Clinical Audit (Free) · A0 portrait (841 × 1189 mm) · Follows: Audit cycle: standard, criteria with targets, first cycle, change, re-audit, action plan
Why it works
An audit poster is judged on its loop. The standard and each criterion with its target come first, the two cycles sit side by side as n/N and % in a table and a chart with the target lines drawn in, and the conclusions say plainly which targets were met, which were not, and who will re-audit when. An audit-cycle diagram with the audit's own dates frames the methods, and a simulated screen (labelled as a mock-up) shows the prompt that was the change.
References on the poster (Vancouver style)
- Benjamin A. Audit: how to do it in practice. BMJ. 2008;336(7655):1241-5. doi:10.1136/bmj.39527.628322.AD
- Ashiru-Oredope D, Sharland M, Charani E, McNulty C, Cooke J. Improving the quality of antibiotic prescribing in the NHS by developing a new Antimicrobial Stewardship Programme: Start Smart—Then Focus. J Antimicrob Chemother. 2012;67 Suppl 1:i51-63. doi:10.1093/jac/dks202
- Davey P, Marwick CA, Scott CL, et al. Interventions to improve antibiotic prescribing practices for hospital inpatients. Cochrane Database Syst Rev. 2017;2(2):CD003543. doi:10.1002/14651858.CD003543.pub4
- Ogrinc G, Davies L, Goodman D, Batalden P, Davidoff F, Stevens D. SQUIRE 2.0 (Standards for QUality Improvement Reporting Excellence): revised publication guidelines from a detailed consensus process. BMJ Qual Saf. 2016;25(12):986-92. doi:10.1136/bmjqs-2015-004411
Download PowerPoint · Open in editor · Use this template
-
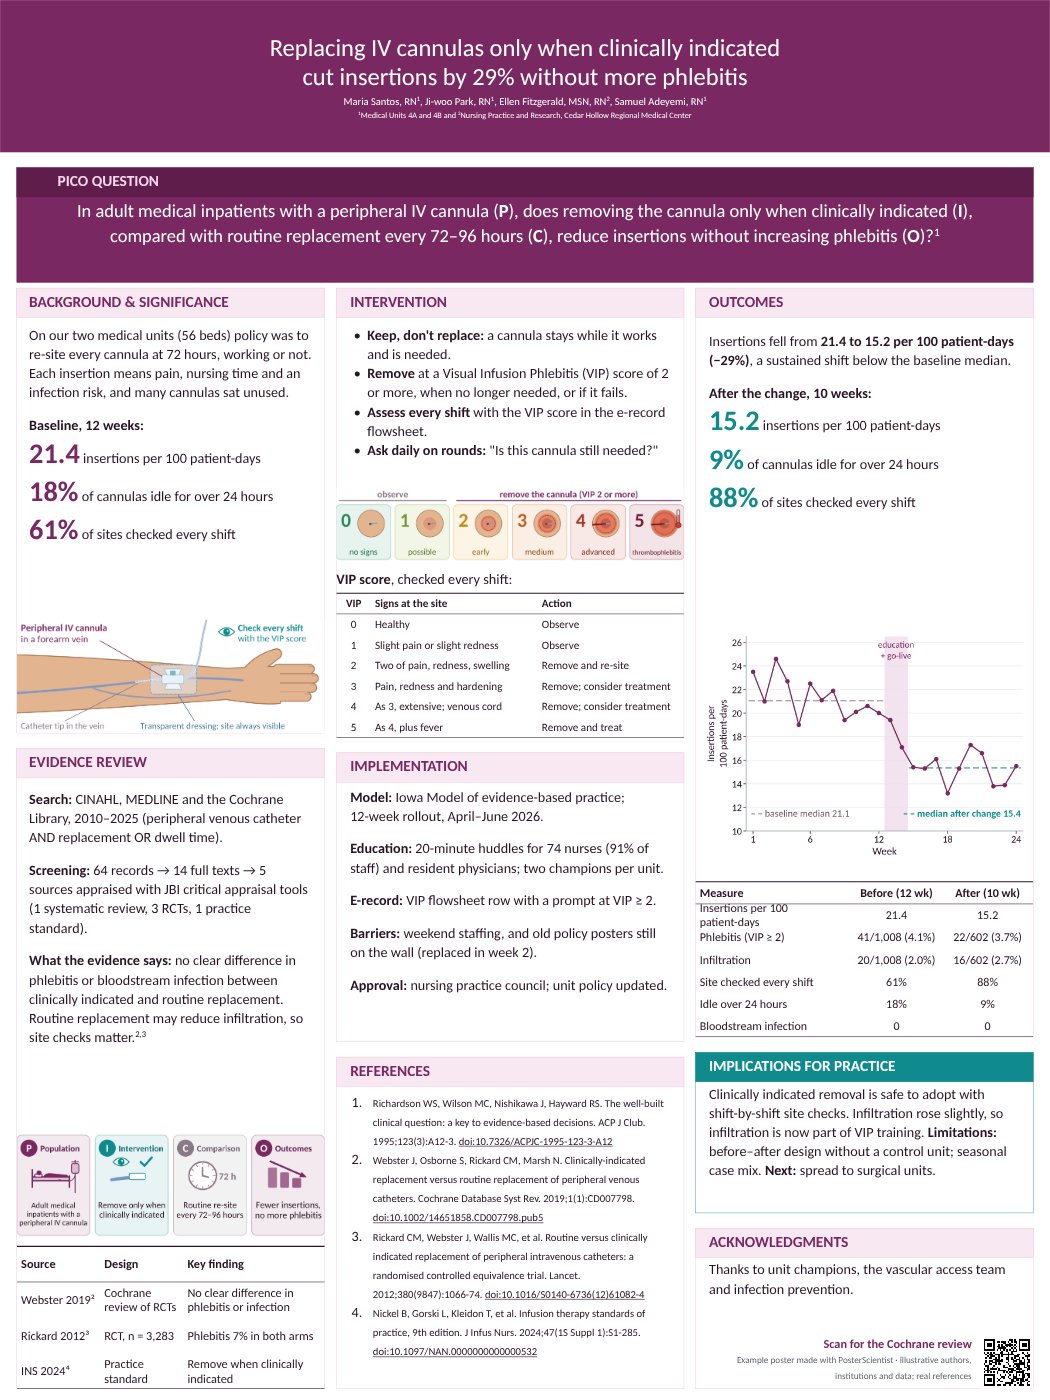
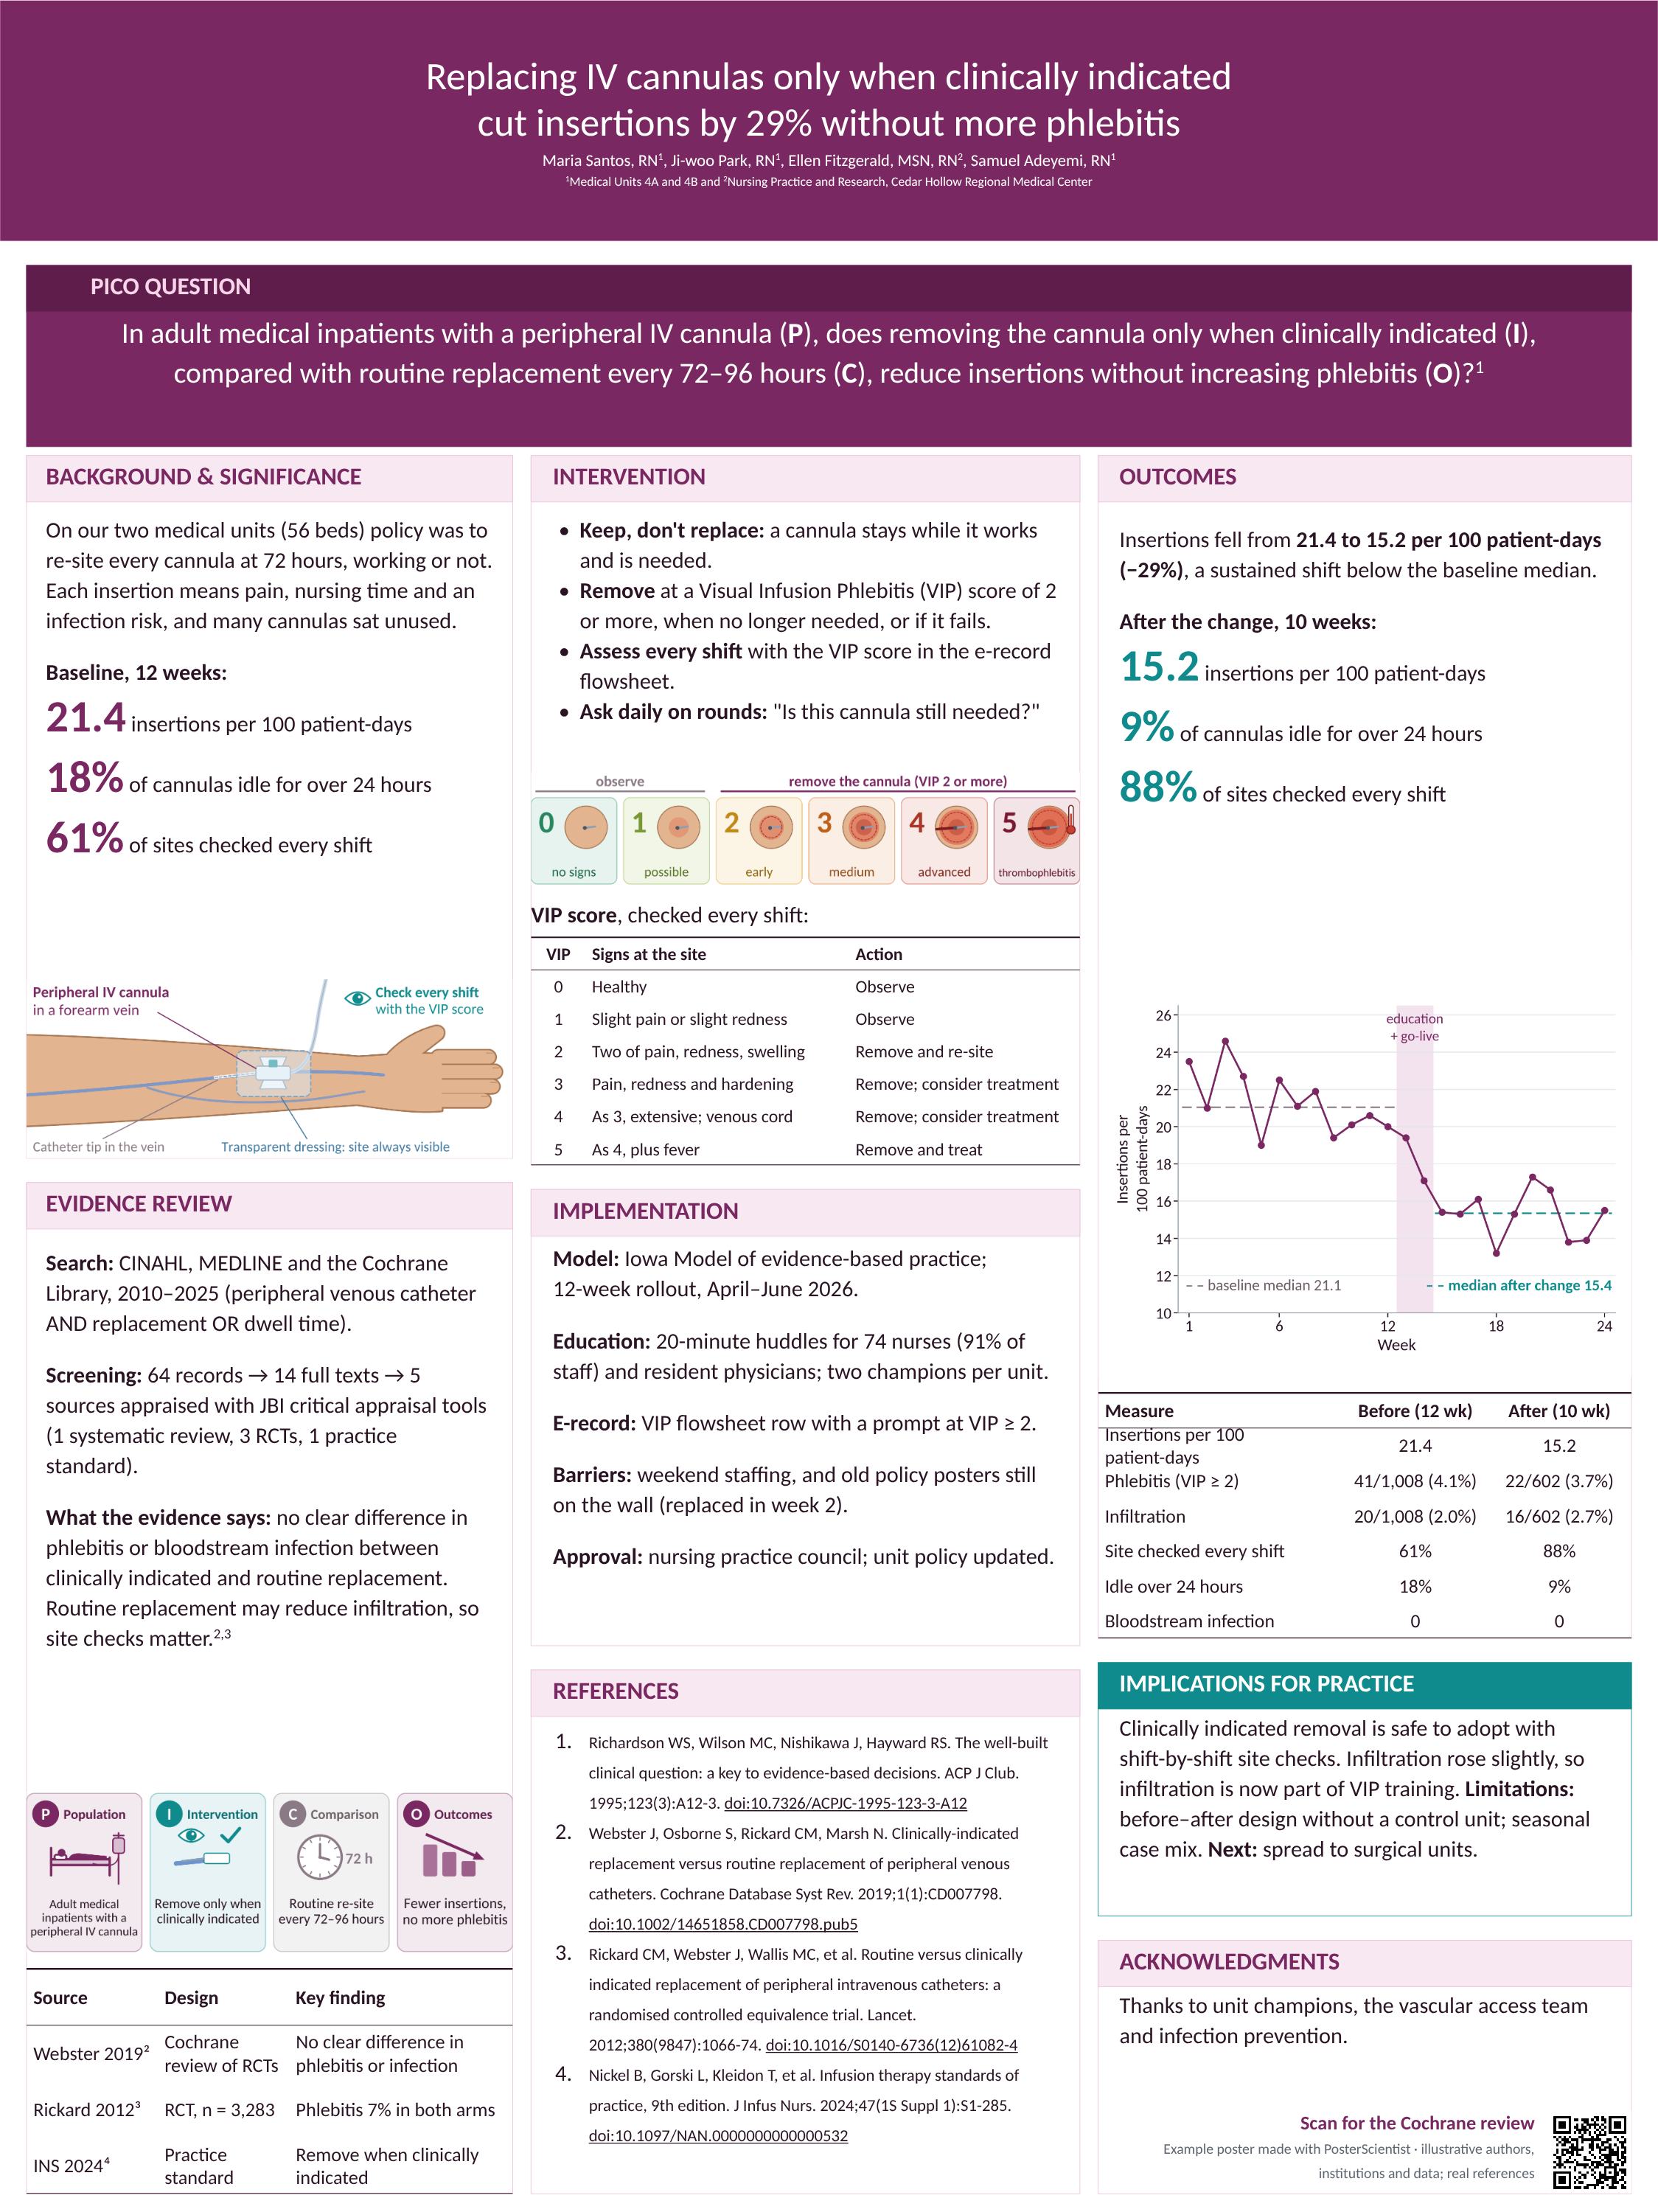
Replacing IV cannulas only when clinically indicated cut insertions by 29% without more phlebitis
Nursing · evidence-based practice project · Template: Nursing Practice (Free) · 36 × 48 in portrait · Follows: PICO question, appraised evidence, implementation model, pre/post outcomes with a run chart
Why it works
The PICO question sits in the banner, so the project is clear before anyone reads further. The evidence box summarises the appraisal honestly (no clear difference in phlebitis, possibly more infiltration), the run chart shows the change over time against the baseline median, and infiltration is reported even though it rose slightly. A forearm drawing, a PICO graphic and VIP score icons make the practice change concrete for busy readers.
References on the poster (Vancouver style)
- Richardson WS, Wilson MC, Nishikawa J, Hayward RS. The well-built clinical question: a key to evidence-based decisions. ACP J Club. 1995;123(3):A12-3. doi:10.7326/ACPJC-1995-123-3-A12
- Webster J, Osborne S, Rickard CM, Marsh N. Clinically-indicated replacement versus routine replacement of peripheral venous catheters. Cochrane Database Syst Rev. 2019;1(1):CD007798. doi:10.1002/14651858.CD007798.pub5
- Rickard CM, Webster J, Wallis MC, et al. Routine versus clinically indicated replacement of peripheral intravenous catheters: a randomised controlled equivalence trial. Lancet. 2012;380(9847):1066-74. doi:10.1016/S0140-6736(12)61082-4
- Nickel B, Gorski L, Kleidon T, et al. Infusion therapy standards of practice, 9th edition. J Infus Nurs. 2024;47(1S Suppl 1):S1-285. doi:10.1097/NAN.0000000000000532
Download PowerPoint · Open in editor · Use this template
-
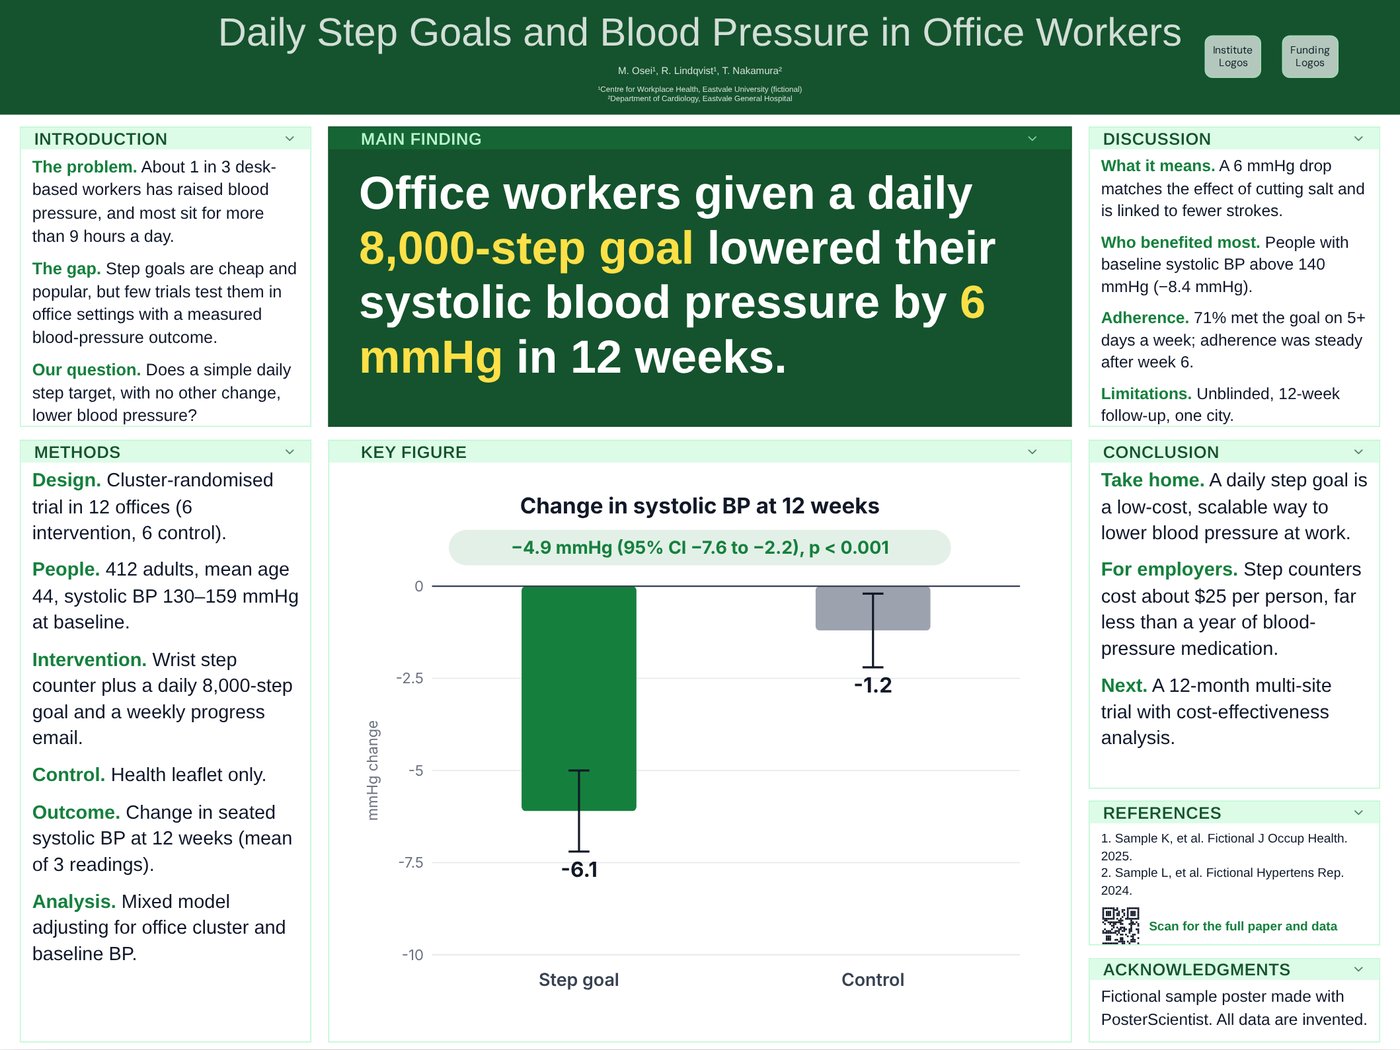
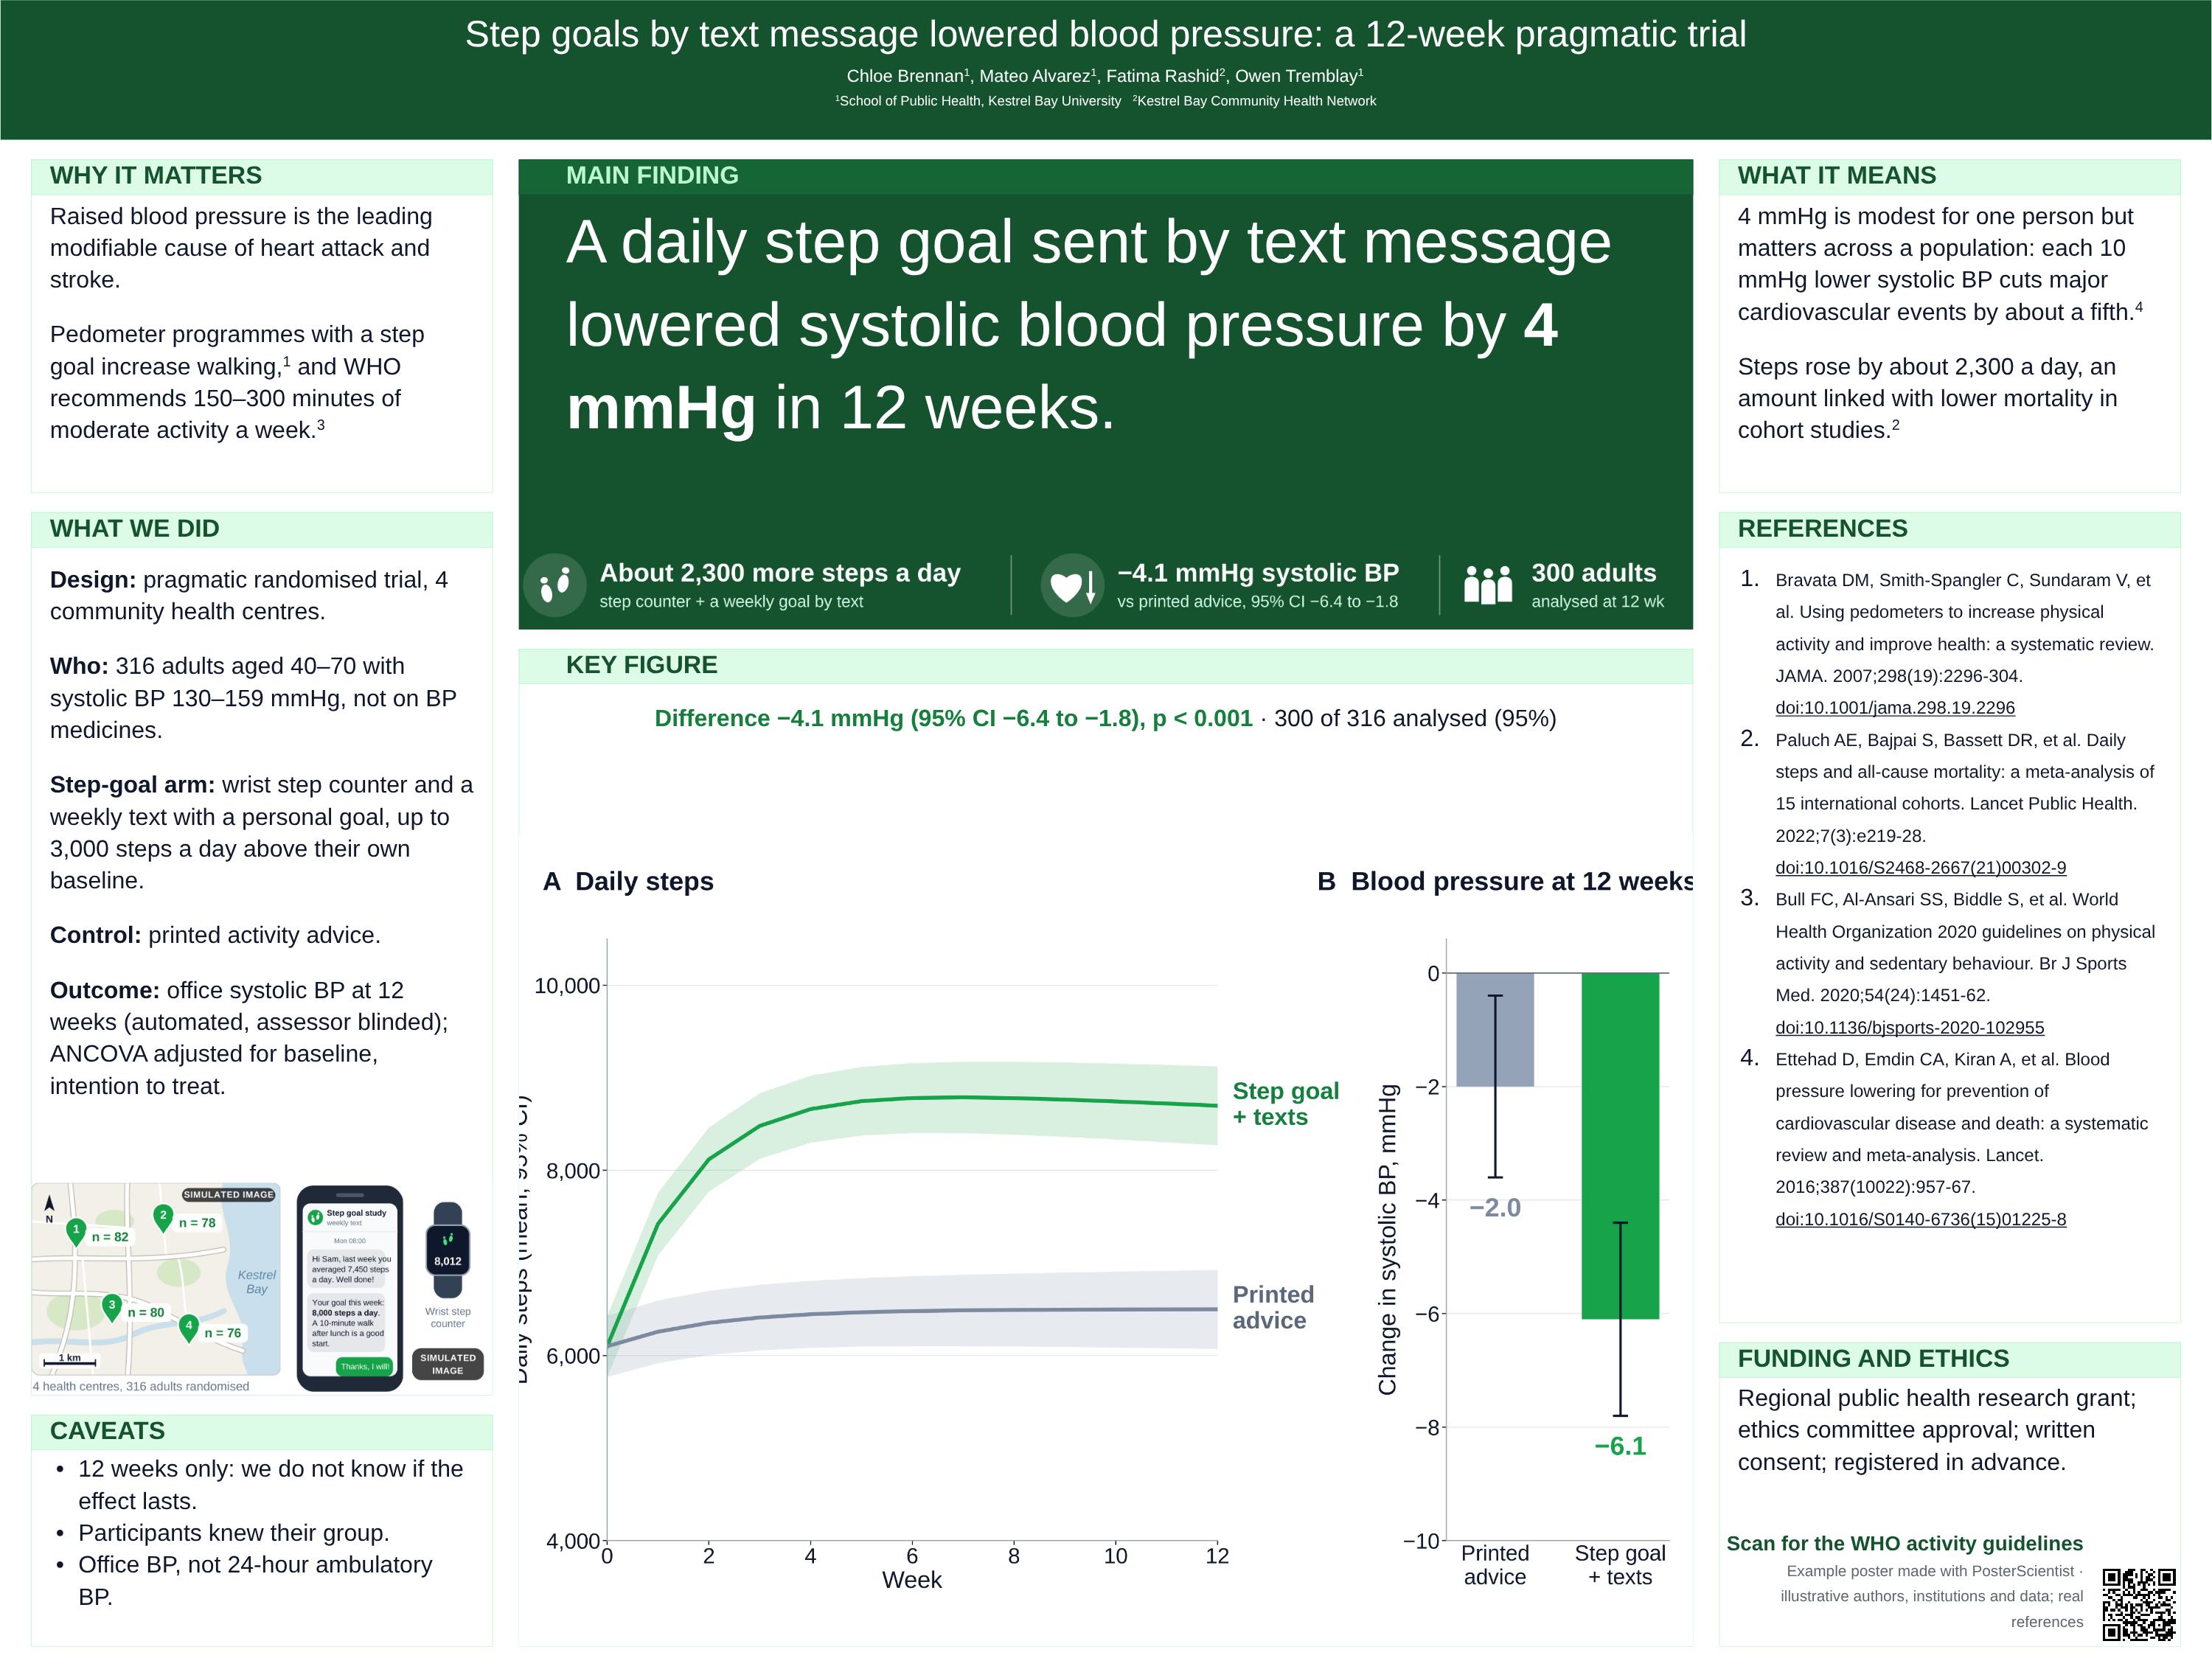
A daily step goal sent by text message lowered blood pressure by 4 mmHg in 12 weeks
Public health · pragmatic trial (better-poster layout) · Template: Billboard (Free) · 48 × 36 in landscape · Follows: #betterposter: plain-language main finding, one key figure, details in the side columns
Why it works
The main finding is one plain sentence in very large type, readable from across the hall, with the key figure directly below it. The side columns hold the background, methods and caveats for people who stop, and the effect is put in context (what a 4 mmHg fall means) without claiming more than a 12-week trial can show. An icon strip under the main finding repeats the numbers that matter, and the methods show the weekly text and the four centres as simulated images (a screen mock-up and a map), each labelled as simulated.
References on the poster (Vancouver style)
- Bravata DM, Smith-Spangler C, Sundaram V, et al. Using pedometers to increase physical activity and improve health: a systematic review. JAMA. 2007;298(19):2296-304. doi:10.1001/jama.298.19.2296
- Paluch AE, Bajpai S, Bassett DR, et al. Daily steps and all-cause mortality: a meta-analysis of 15 international cohorts. Lancet Public Health. 2022;7(3):e219-28. doi:10.1016/S2468-2667(21)00302-9
- Bull FC, Al-Ansari SS, Biddle S, et al. World Health Organization 2020 guidelines on physical activity and sedentary behaviour. Br J Sports Med. 2020;54(24):1451-62. doi:10.1136/bjsports-2020-102955
- Ettehad D, Emdin CA, Kiran A, et al. Blood pressure lowering for prevention of cardiovascular disease and death: a systematic review and meta-analysis. Lancet. 2016;387(10022):957-67. doi:10.1016/S0140-6736(15)01225-8
Download PowerPoint · Open in editor · Use this template
-
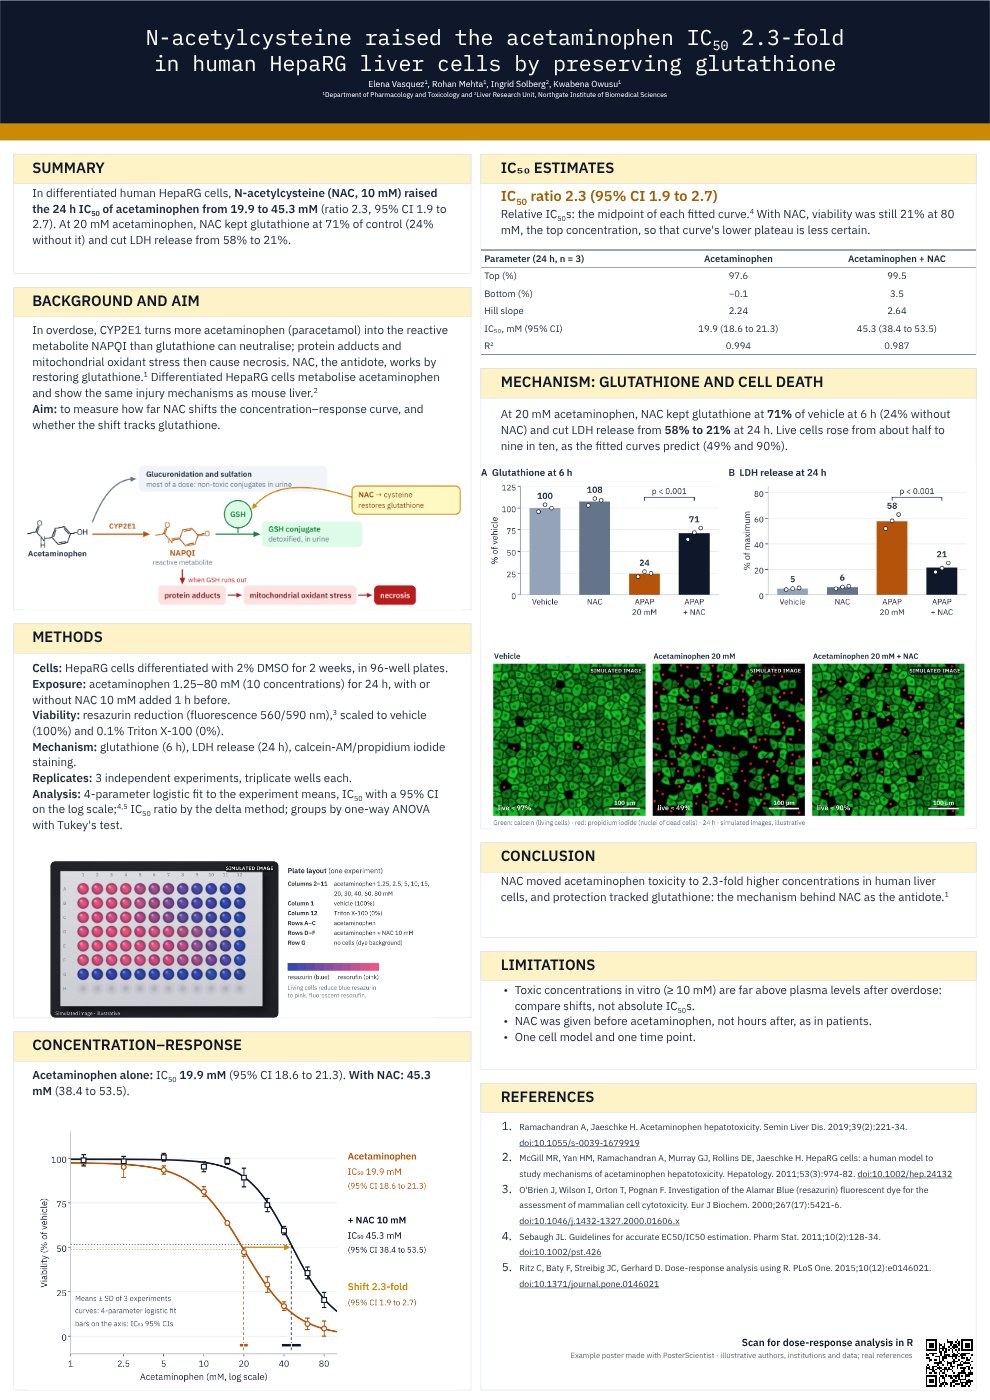
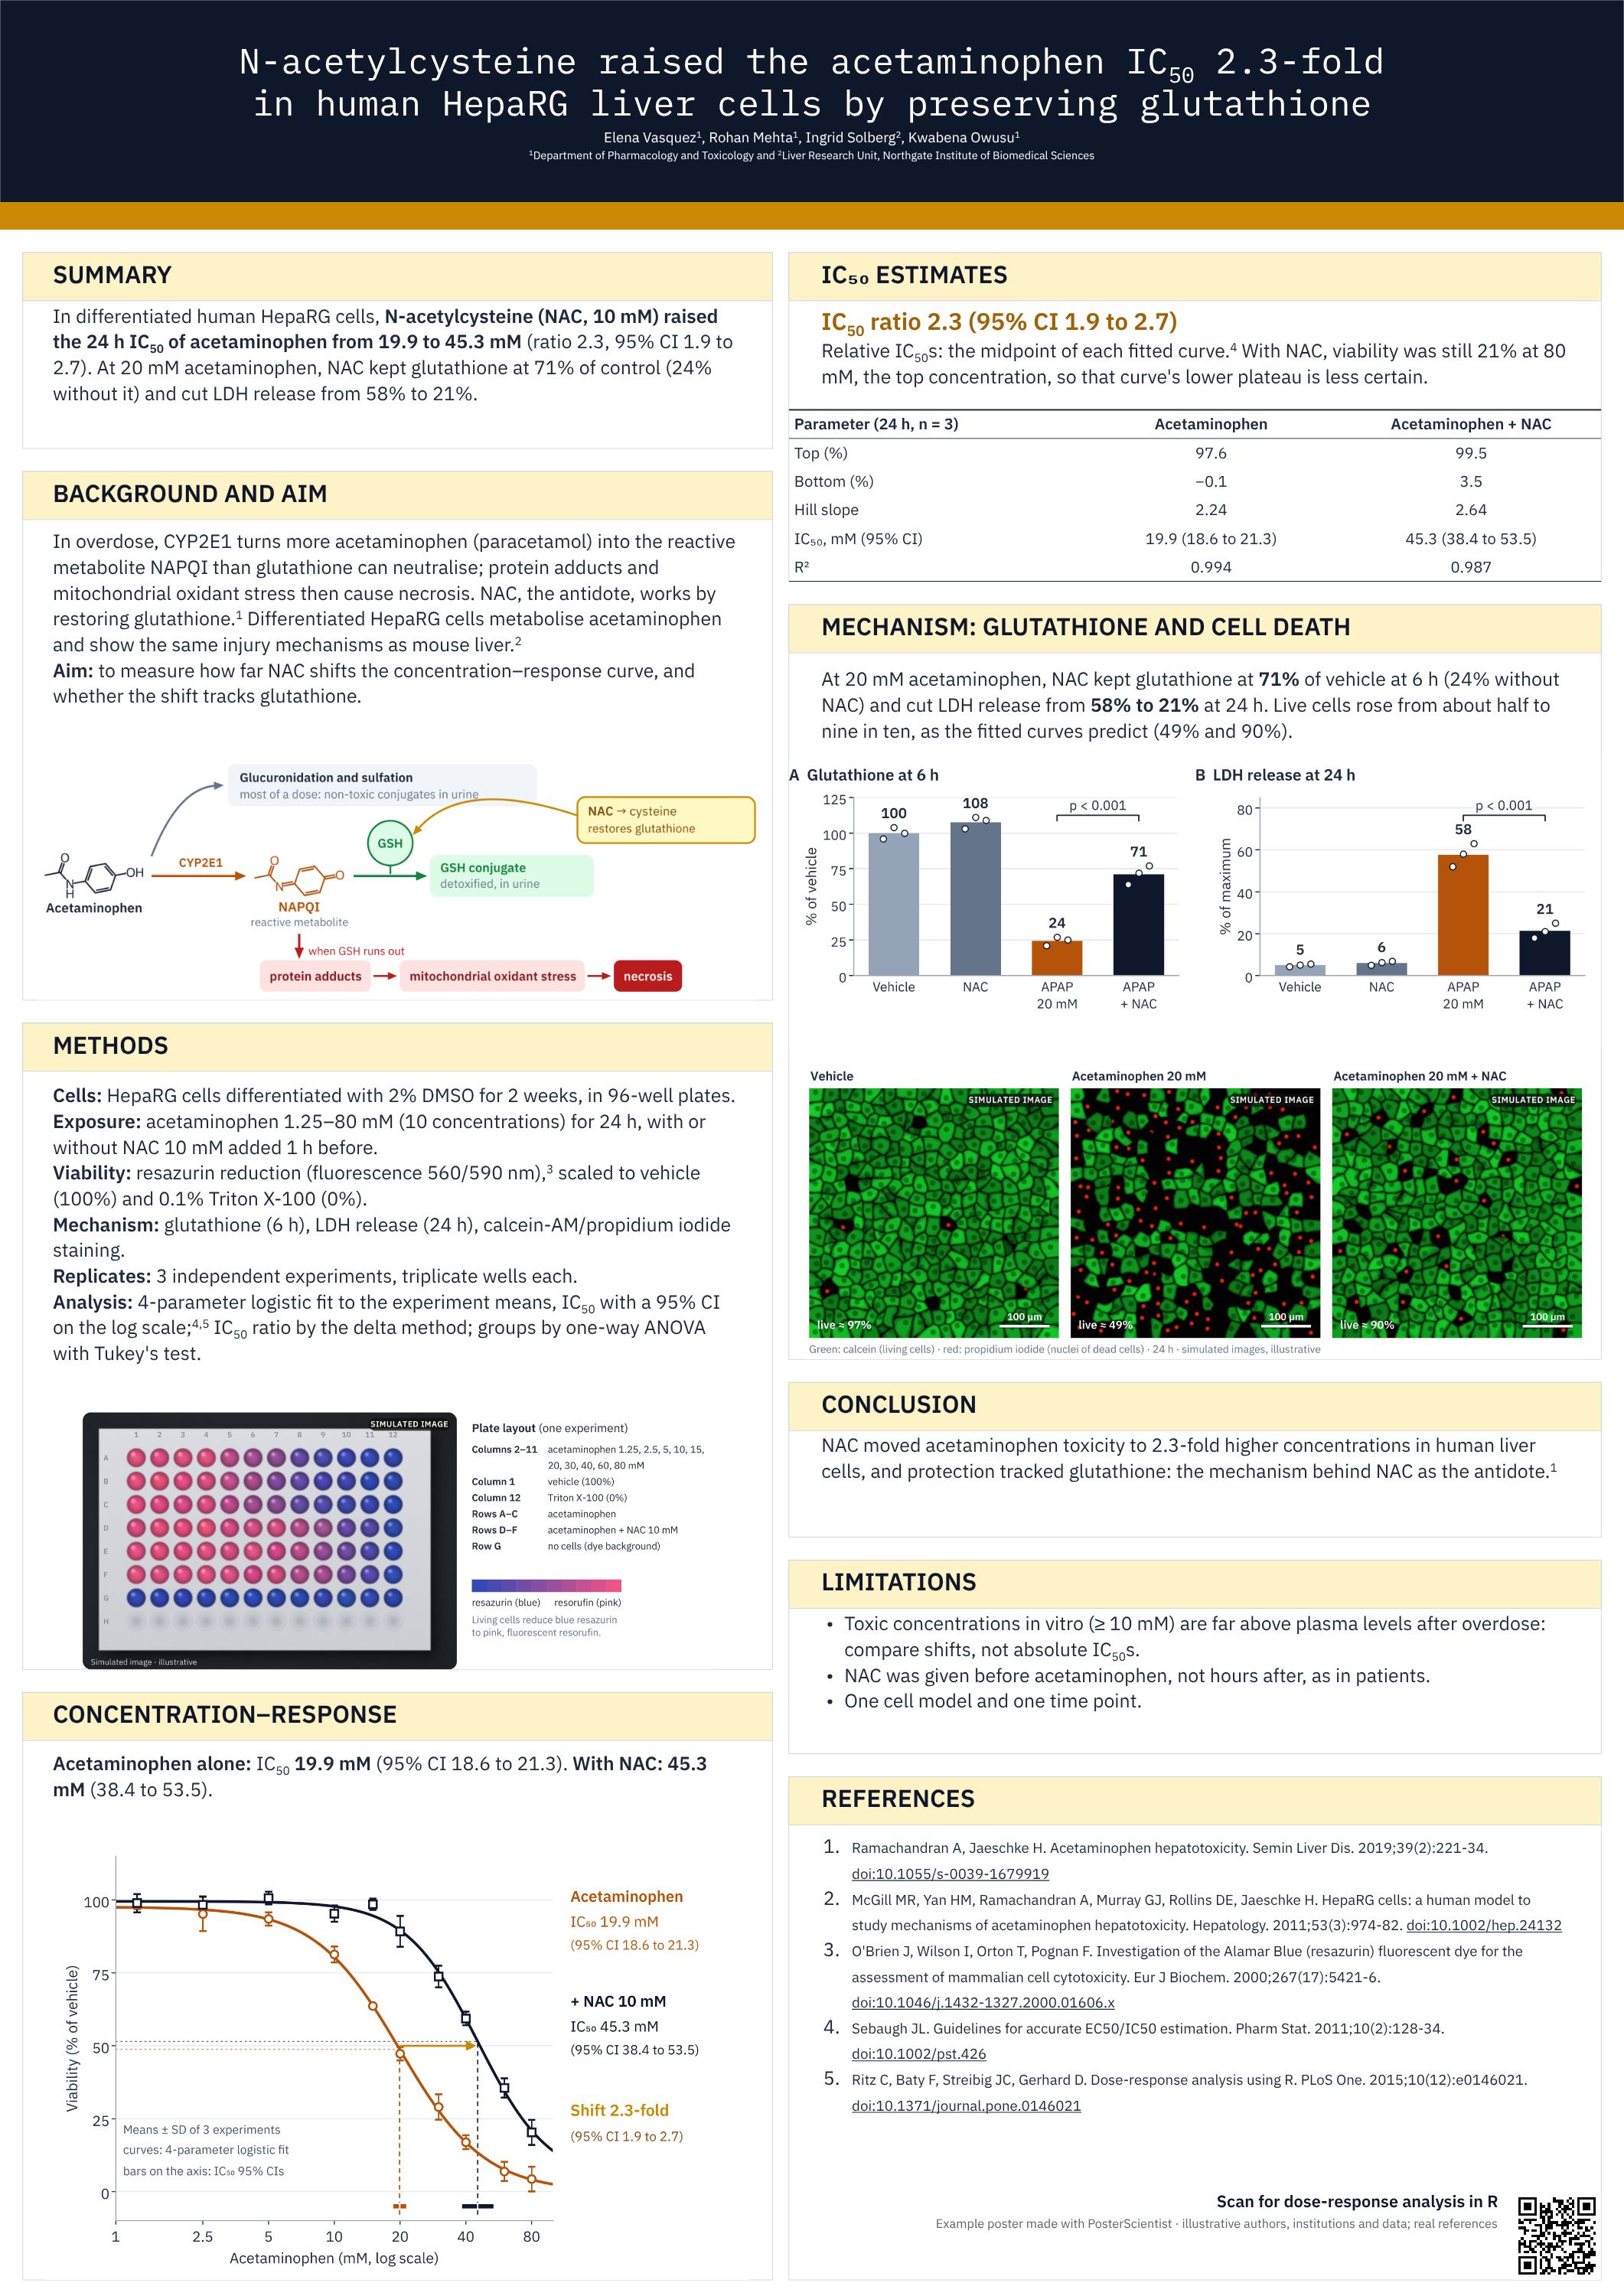
N-acetylcysteine raised the acetaminophen IC₅₀ 2.3-fold in human HepaRG liver cells by preserving glutathione
Toxicology · in vitro dose–response study · Template: Dark Conference (Free) · A0 portrait (841 × 1189 mm) · Follows: In vitro toxicology: concentration–response with a 4-parameter logistic fit, IC₅₀ with 95% CI, independent experiments, mechanistic endpoints
Why it works
The main figure is the concentration–response curve: means and SDs of three independent experiments, the fitted four-parameter logistic curves and each IC₅₀ with its 95% CI, so the 2.3-fold shift can be read off the axis. A table gives every fitted parameter, glutathione and LDH bars show the mechanism, and a pathway drawing explains why NAC protects. The 96-well plate and the live/dead microscopy panels are simulated images, labelled as such (the microscopy with 100 µm scale bars), and the share of live cells they show matches the fitted curves at 20 mM.
References on the poster (Vancouver style)
- Ramachandran A, Jaeschke H. Acetaminophen hepatotoxicity. Semin Liver Dis. 2019;39(2):221-34. doi:10.1055/s-0039-1679919
- McGill MR, Yan HM, Ramachandran A, Murray GJ, Rollins DE, Jaeschke H. HepaRG cells: a human model to study mechanisms of acetaminophen hepatotoxicity. Hepatology. 2011;53(3):974-82. doi:10.1002/hep.24132
- O'Brien J, Wilson I, Orton T, Pognan F. Investigation of the Alamar Blue (resazurin) fluorescent dye for the assessment of mammalian cell cytotoxicity. Eur J Biochem. 2000;267(17):5421-6. doi:10.1046/j.1432-1327.2000.01606.x
- Sebaugh JL. Guidelines for accurate EC50/IC50 estimation. Pharm Stat. 2011;10(2):128-34. doi:10.1002/pst.426
- Ritz C, Baty F, Streibig JC, Gerhard D. Dose-response analysis using R. PLoS One. 2015;10(12):e0146021. doi:10.1371/journal.pone.0146021
Download PowerPoint · Open in editor · Use this template
What makes these medical posters work
- Titles that report the result with its size: "more than halved the risk of transfusion", not "tranexamic acid in knee replacement".
- Flow diagrams that account for every participant or record, with numbers that add up at each step.
- Effect sizes with 95% confidence intervals next to the main figure, not only p-values.
- Harms, limitations and certainty of evidence (for reviews, GRADE) stated plainly.
- Vancouver references with DOIs, and a QR code that opens the reporting guideline or the full paper.
Which example to follow
Presenting a single patient? Follow one of the case reports. Comparing treatments in routine data? The cohort study shows how to present confounding, an adjusted hazard ratio and a survival curve. Pooling published trials? The systematic review shows a PRISMA flow, a forest plot and a GRADE summary on one landscape poster. Nurses and allied health professionals presenting a practice change can follow the nursing evidence-based practice project or the clinical audit.
Frequently asked questions
What size is a medical conference poster?
It depends on the meeting. A0 portrait (841 × 1189 mm) is the most common size in Europe, Asia and Australia, and 48 x 36 in landscape or 36 x 48 in portrait in North America. Always check the call for posters; every example here can be switched to another size in the editor.
Which citation style should a medical poster use?
Vancouver (numbered) style is standard in medicine, nursing and public health, and is what these examples use. Follow the conference's instructions if they ask for something else.
Are these real studies?
No. The authors, patients and data are illustrative, made up to show a finished poster, and should not be cited. The references are real and were checked, so you can follow them to the reporting guidelines and key papers.
Can I edit these examples?
Yes. Download one as PowerPoint, or open it in the free online editor to change the text, tables, figures, colours and size.